R的简单教程--03进阶-2
r-rbase华中科技大学–组学数据分析与可视化课程–大二上课程笔记第三部分,包括并行计算、ggplot2基础、常用统计学函数、参数/非参数检验、线性/非线性回归等
写在前面:本篇内容及例子(除标注了参考文章/具体案例的部分,以及一些比较零碎的小知识点)均来自华中科技大学–组学数据分析与可视化课程–大二上 / 笔记中使用的数据 / 关于本课程的复习资料 / 课程作业答案 / 课程作业答案–中文注释版
并行计算
即同时执行多个计算任务以加速整体的处理速度,通过在多个处理器或多个计算节点上同时执行代码来实现
一般需要3个步骤:
-
分解并发放任务
-
分别计算
-
回收结果并保存
相关的包:
-
parallel包:显示CPU core数量,将全部或部分CPU核心分配给任务。在任务完成后,要回收分配的CPU core -
foreach包:提供%do%和%dopar%操作符,以提交任务,进行顺序或并行计算 -
辅助包
iterators:将data.frame、tibble、matrix等数据结构分割为行/列,用于提交并行任务
install.packages( "parallel" );
install.packages( "foreach" );  # 会自动安装 iterators
一个简单的例子:
library(parallel);
library(foreach);
library(iterators);
# 检测有多少个CPU core
cpus <- parallel::detectCores();  # 返回一个整数,表示CPU core数量
# 创建一个data.frame
d <- data.frame(x=1:10, y=rnorm(10));
# 创造一个cluster集群进行计算
cl <- makeCluster( cpus - 1 );
# 分配任务
res <- foreach( row = iter( d, by = "row" ) ) %dopar% {
  return ( row$x * row$y  );
}
# 注意在最后关闭创建的cluster,释放资源
stopCluster( cl );
补充说明:
res <- foreach( row = iter( d, by = "row" ) ) %dopar% {
  return ( row$x * row$y  );
}
其中:
-
row = iter( d, by = "row" )表示将输入数据d按行row或列col遍历,每次取出一行/一列,赋予row这个变量(可随意取名) -
foreach函数将数据row分发给cl(这里没有体现出来),进行计算row$x * row$y,并返回结果 -
.combine = 'c'参数规定将返回结果合并为vector该参数的可能值:
-
'c'将返回值合并为vector,当返回值是单个数字或字符串的时候使用 -
'cbind'将返回值按列合并 -
'rbind'将返回值按行合并 -
默认情况下返回list
-
foreach函数的其它参数.packages=NULL:将需要的包传递给任务,例如当每个任务需要提前装入tidyverse包时,可以.packages=c("tidyverse")
嵌套foreach:有些情况下需要用到嵌套循环,使用以下语法–
foreach( ... ) %:% {
  foreach( ... ) %dopar% {
    # 语句
  }
}
即外层的循环部分用%:%操作符
例:将下面的计算转为并行计算
mtcars %>%
    split( .$cyl ) %>%
    map( ~ cor.test( .$wt, .$mpg ) ) %>%
    map_dbl( ~.$estimate );
运行结果为:
         4          6          8
-0.7131848 -0.6815498 -0.6503580
使用并行计算:
cpus <- parallel::detectCores();
cl2 <- makeCluster( cpus - 1 );
res2 <- foreach(
    df = iter(  mtcars %>% split( .$cyl )  ),
    .combine = 'rbind'
    ) %dopar% {
        cor.res <- cor.test( df$wt, df$mpg );
        return ( c(cor.res$estimate, cor.res$p.value) );  #注意这里的返回值是vector
    }
res2;
-
df = iter(mtcars %>% split( .$cyl )):将mtcars按汽缸数cyl分割为3个list,依次赋予df -
cor.res <- cor.test(df$wt, df$mpg);:计算每个df中wt与mpg的关联,将结果保存在cor.res变量中 -
.combine = 'rbind':由于返回值是vector,用此命令按行合并
运行结果为:
                cor
result.1 -0.7131848 0.01374278
result.2 -0.6815498 0.09175766
result.3 -0.6503580 0.01179281
其中第二列是p值,第一列就是上面普通计算得到的结果
其它并行计算函数:parallel包本身也提供了lapply等函数的并行计算版本,包括parLapply、parSapply、parRapply、parCapply等
例:计算2的N次方
cl<-makeCluster(3);
parLapply(
  cl,  # 使用cl集群计算
  2:4,  # 要遍历的数据
  function(exponent)  # 将每个元素传给exponent
    2^exponent  # 返回2的exponent次方
);
stopCluster(cl);
运行结果为一个列表:
[[1]]
[1] 4

[[2]]
[1] 8

[[3]]
[1] 16
ggplot2基础
基本参数
ggplot(data, aes(x, y, colour, fill, shape, size, group,...)) +
  geom_<layer_name>() +
  其它控制函数
-
data标识使用的数据集 -
aes(aesthetics)美学:控制全局参数,包括x,y轴使用的数据、颜色(colour、fill) 、形状 (shape)、大小(size)、分组(group)等等 -
geom_<layer_name>绘制不同的图层:每张图可有多个图层,每个图层都可使用全局数据(data)和参数(aes),也可以使用自己函数中指定的aes和数据 -
ggplot()主函数与其它函数间使用+连接
一个例子:
-
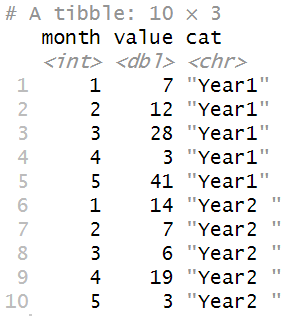
准备数据
year1 <- c(7, 12, 28, 3, 41);
year2 <- c(14, 7, 6, 19, 3);
df <- rbind(
  tibble( month = 1:length( year1 ), value = year1, cat = "Year1" ),
  tibble( month = 1:length( year2 ), value = year2, cat = "Year2 ")
);
-
画图,并将结果保存都变量中
plot1 <-  ## 将图保存在变量中;
  ggplot( df, aes( x = month, y = value, colour = cat) ) +  # 指定数据、xy轴使用哪列、根据哪列区分不同颜色
  geom_line() +  # 画折线
  geom_point() +  # 画点
  xlab( "Month" ) + ylab( "Rain fall" ) +  # 指定xy轴名称
  labs( colour = "Year");  # 图例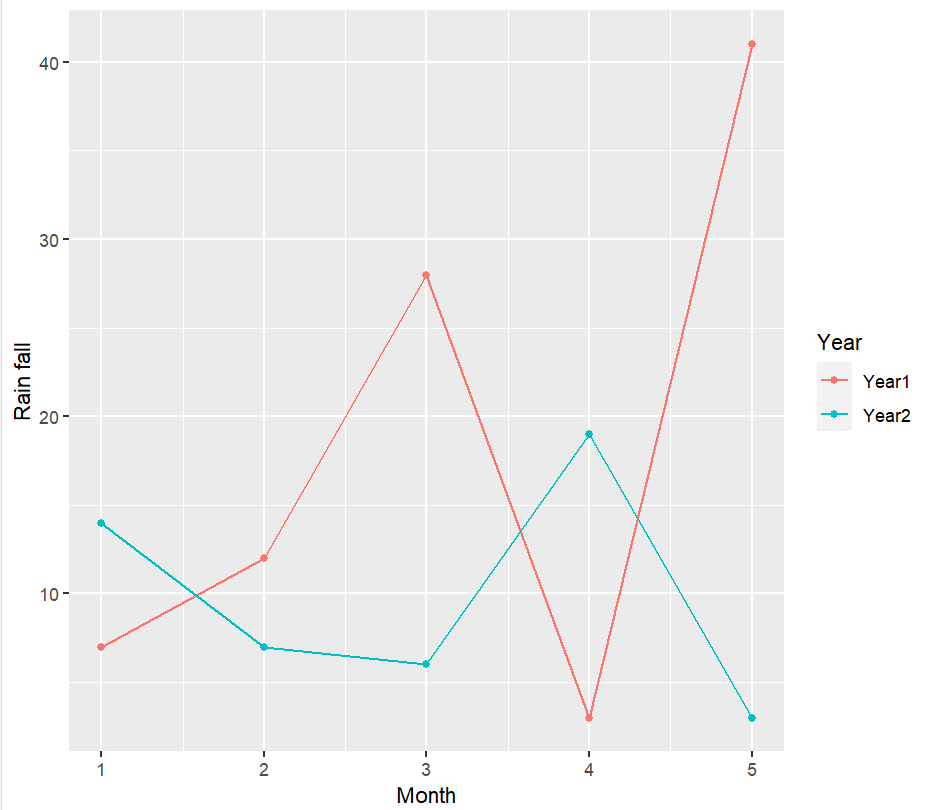
-
添加新图层,新图层使用自己的数据
plot1 +
  geom_point(
    data = data.frame( x2 = 1:5, y2 = sample(30:100, 5) ),  # 注意data=是必须的
    aes( x = x2, y = y2 ),  # 使用自己的aes
    colour =  c("darkgreen", "red", "blue", "gold", "purple") ,
    shape = 15,
    size = 4
  );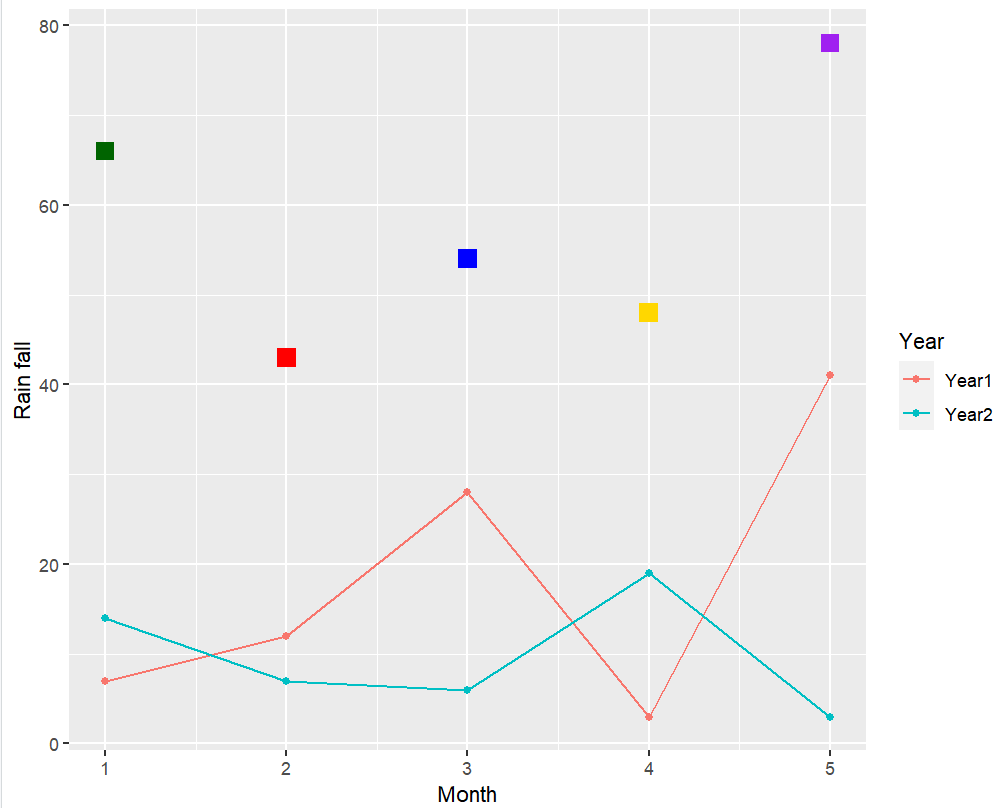
从上面的例子中可以发现:
-
xy轴范围会随数据自动调整
-
ggplot2作图结果可以保存在变量中,并可在其基础上累加更多图层
-
图层使用自己的数据时,需要用
data=指定;而全局数据(ggplot(data,aes()))则不用
ggplot2作图的四个基本组成部分
-
图层:
geom_<图层名>-
geom_point/geom_line:点/线图,用于揭示两组数据间的关系 -
geom_smooth:拟合曲线图,常与geom_point联合使用,揭示数据走势 -
geom_bar:条形图 -
geom_boxplot:箱线图,用于比较N组数据,揭示区别 -
geom_path:与geom_line相似,但也可以画其它复杂图形 -
geom_histogram/geom_density:数据的分布,也可用于多组数据间的比较
-
-
scale显示控制,基本语法为
scale_<控制内容>_<控制手段>,例如scale_color_manual表示以手选方式(manual)控制颜色(color)4种基本控制:
-
scale_color_...(边框)颜色 -
scale_fill_...填充颜色(如果图中的点支持填充的话,如果不支持就只有color) -
scale_shape_...形状 -
scale_size_...尺寸
-
-
坐标系统
coord_...-
线性坐标系统:
-
coord_cartesian默认使用的坐标系统,可以实现局部缩放的效果 -
coord_flip交换xy轴 -
coord_fixed用特定的长宽比例作图
-
-
非线性坐标系统:
-
coord_trans对x/y轴进行变换,如让y轴取原来的log10,这样就得到不均匀的y轴 -
coord_polar极坐标图,可以实现柱图变饼图 -
coord_map用于地图的绘制
-
-
-
子图
facet_...:将一个数据集用多个子图来表示,每个子图表示数据集的不同子集-
facet_grid指定将数据集按哪列分组 进行子图的绘制 -
facet_wrap指定子图的排列(几行几列、方向等)
-
之后会从这4部分完成对ggplot2基础的介绍
scale显示控制
color
一个关于颜色的简单图:
ggplot(iris,  # 使用iris数据
       aes(
         x=Sepal.Length,  # 长度
         y=Sepal.Width,  # 宽度
         color=Species  # 同物种的数据点有相同颜色
         )) +
  geom_point(size=2);  # 画散点图

可以看到:
-
color=Species指定了根据Species列决定颜色 -
共需要3种颜色
-
此时的颜色由默认色板决定
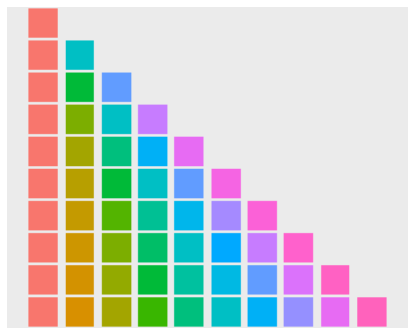
根据需要的颜色数量,取相应的行
使用其它色板:scale_colour_brewer(palette="<palette name>")
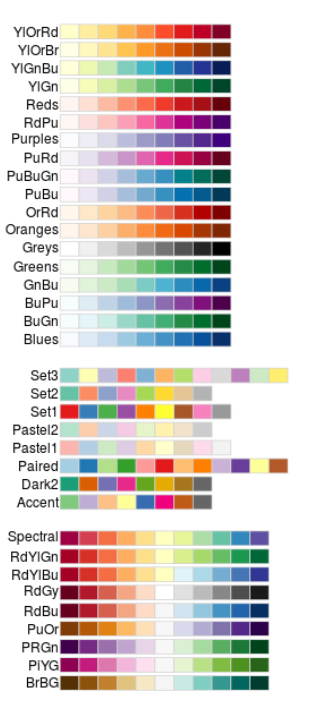
左侧为色板名称,右侧为其包含的颜色。使用时需要几种颜色,就取其前几种颜色
例:
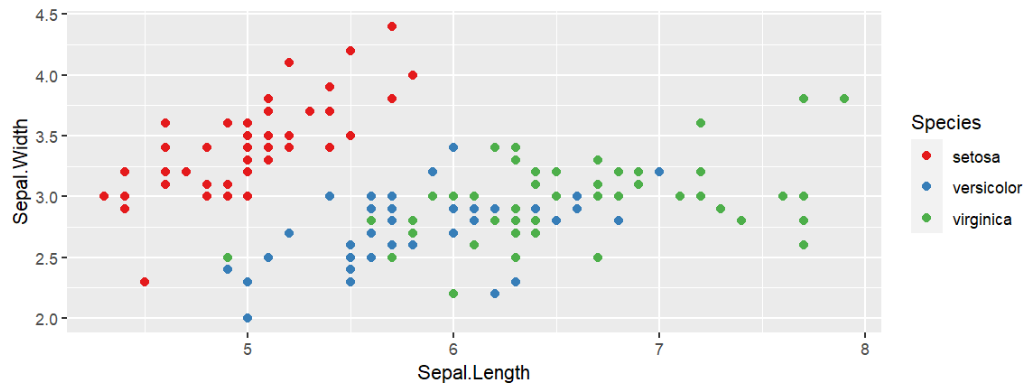
ggplot(iris, aes(x=Sepal.Length, y=Sepal.Width, color=Species)) +
  geom_point(size=2) +
  scale_color_brewer( palette = "Set1" );
手动设置颜色:scale_colour_manual(break=c(值1, 值2, ...), values=(c(颜色1, 颜色2, ...)))
在此之前,需指定颜色根据哪列来取,该列值为值1的点颜色为颜色1
mtcars %>%
  ggplot( aes(disp, mpg) ) +
    geom_point( aes( color = factor(cyl) ) ) +
  # 也可以写成
  # ggplot(aes(x=disp, y=mpg, color=factor(cyl))) +
  #   geom_point() +
    scale_color_manual(
      breaks = c("4","6","8"),  # cyl列值为4的点颜色为红色...
      values = c("red","green","blue")
    );
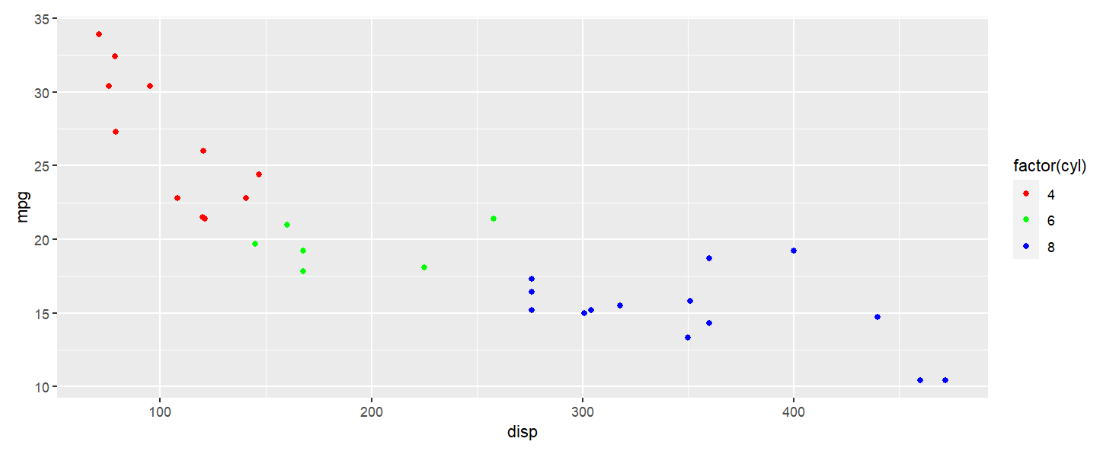
注意:使用该方法指定颜色根据哪列来取时,不能使用color=列名的方法,必须为color=factor(列名),这是因为这个方法只能用于列值为离散值的情况,factor函数用于将这列的列值去重提取,便于与scale_colour_manual函数中的breaks参数适配
使用渐变颜色:scale_color_gradient(low=颜色1, high=颜色2)即为颜色1->颜色2的渐变
mpg %>%
  ggplot( aes(displ, hwy) ) +
  geom_point( aes( color = displ ) ) +
  scale_color_gradient( low = "black", high = "yellow" );
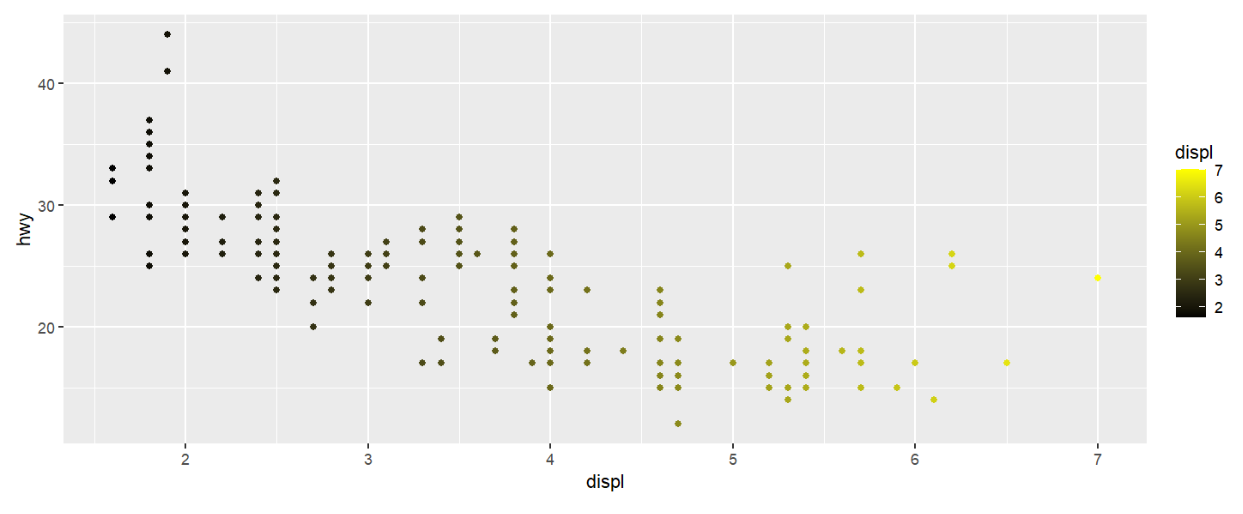
该方法不需要颜色决定列为离散值,直接color=颜色决定列即可
更多种类的渐变:
-
scale_colour_gradient2(low=颜色1, mid=颜色2, high=颜色3, midpoint)设置颜色1->颜色2->颜色3的连续渐变,midpoint指定渐变中点对应的颜色决定列值mpg %>% ggplot( aes(displ, hwy) ) + geom_point( aes( color = displ ) ) + scale_colour_gradient2( low = "black", mid = "red", high = "yellow", midpoint = 4.5 );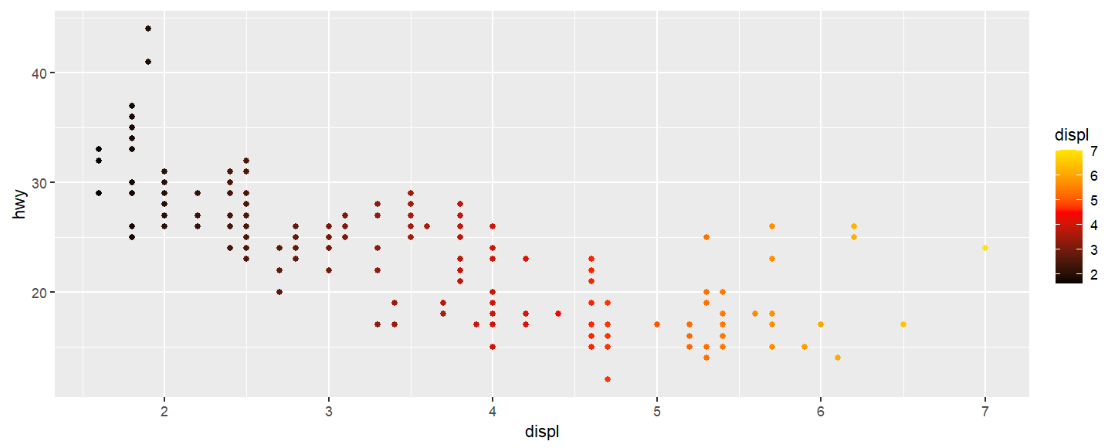
-
scale_colour_gradientn(colors=c(颜色1, 颜色2, ...))设置更多渐变中点mpg %>% ggplot( aes(displ, hwy) ) + geom_point( aes( color = displ ) ) + scale_colour_gradientn( colors = c("black","red", "yellow", "blue", "pink") );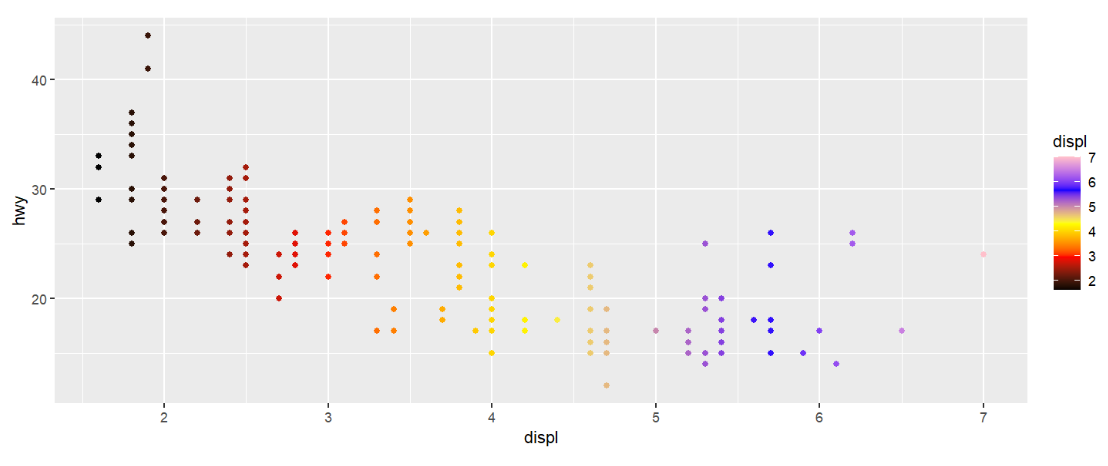
-
即分组又渐变:
scale_color_binned(low=颜色1, high=颜色2),可以理解成非连续的渐变–一定范围内的数据被划为一组,组内数据点颜色相同,不同组的颜色构成渐变mpg %>% ggplot( aes(displ, hwy) ) + geom_point( aes( color = displ ) ) + scale_color_binned( low = "black", high = "yellow" );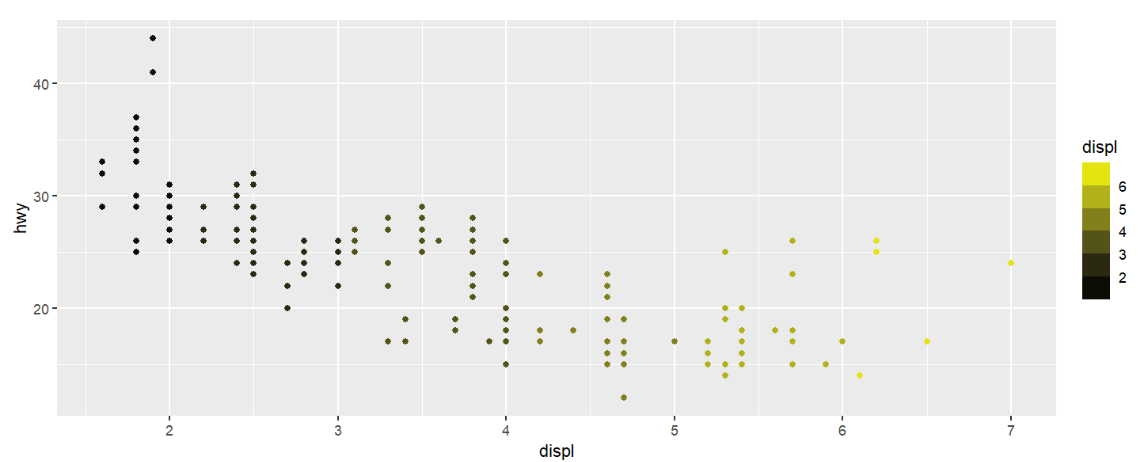
fill
与color的区别:fill指填充色(如果数据点可以设置填充的话),而color指边框色(stroke/outline),它们都默认为黑色
有填充色的点:shape为21-25的点,其它点均无填充色,只有color
mpg %>%
  ggplot( aes(displ, hwy) ) +
  geom_point( aes( colour = cyl ), shape = 21, stroke = 2);
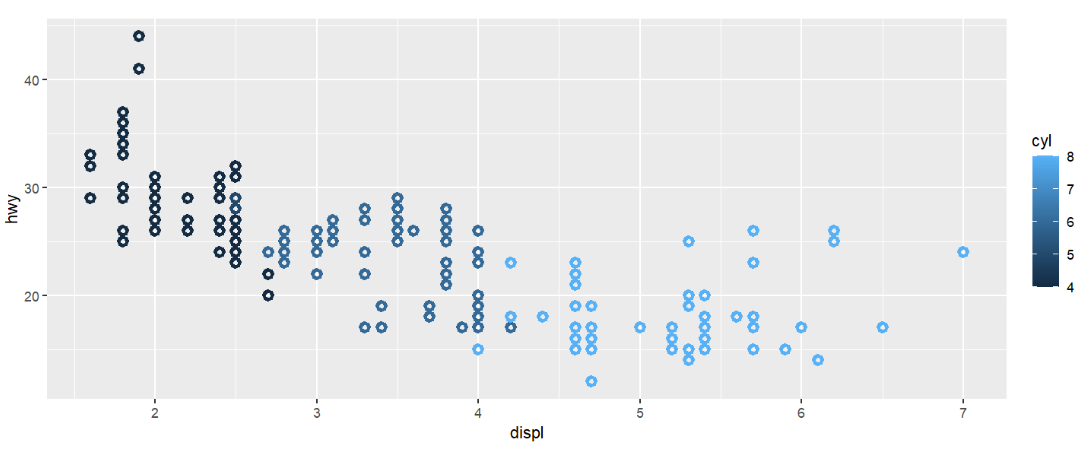
其中stroke参数指定边框线的粗细,不同与size(参数指定点的大小)
fill和color可以根据不同列来取值:
mpg %>%
  ggplot( aes(displ, hwy) ) +
  geom_point( aes(
    colour = cyl,  # color根据cyl来取
    fill = class ),  # fill根据class来取
    shape = 21, size = 5,stroke = 2);
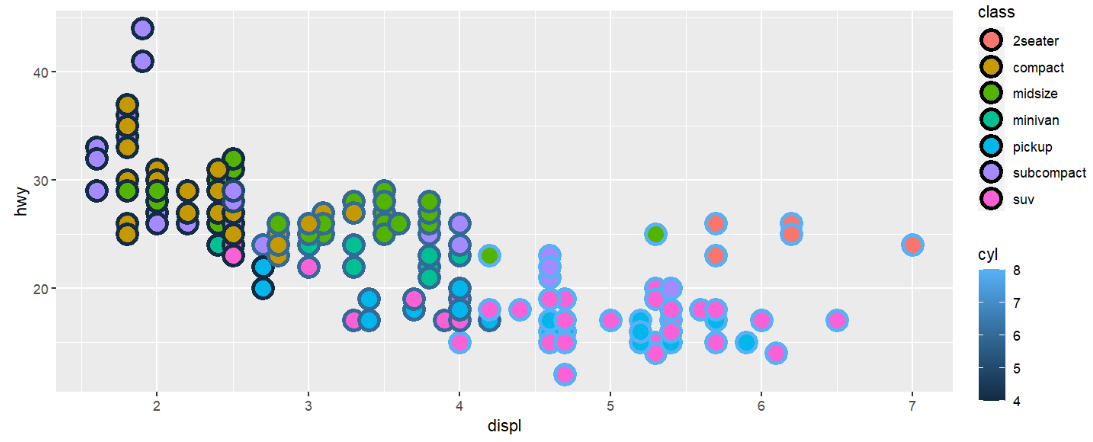
fill的色板与color相同
mpg %>%
  ggplot( aes(displ, hwy) ) +
  geom_point( aes( fill = class ), shape = 21, stroke = 1.5) +
  scale_fill_brewer( palette = "Set1" );
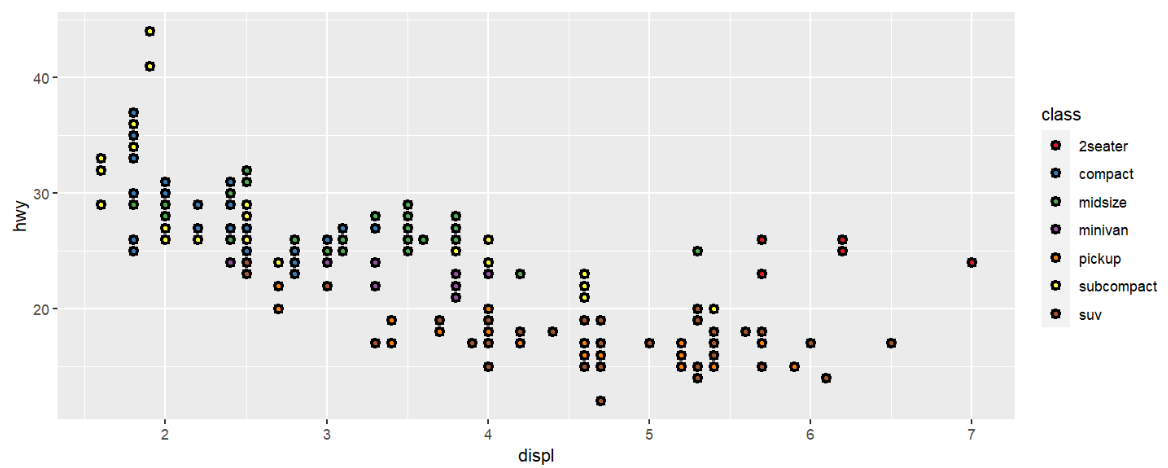
mpg %>%
  ggplot( aes(displ, hwy) ) +
  geom_point( aes( fill = cyl ), shape = 21, stroke = 1) +
  scale_fill_gradient( low = "yellow", high = "blue" ) ;
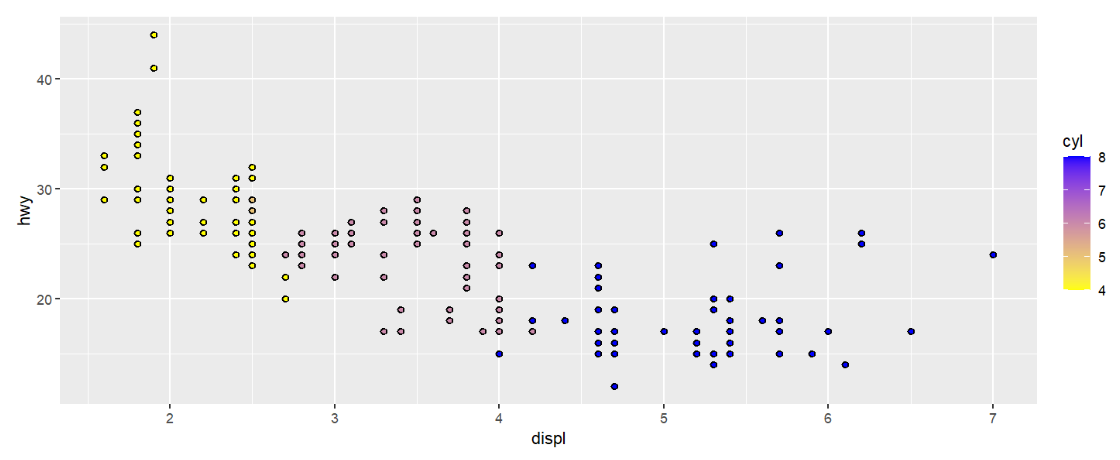
总结:
-
两个匹配:
-
aes中的
fill与函数scale_fill_xxx匹配,color与函数scale_color_xxx匹配 -
数据类型与色板类型匹配:连续数据配渐变色板,离散数据配离散色板
-
-
fill与color的色板相同,函数也通用(如scale_fill_brewer对应scale_color_brewer) -
有些shape/pch只有color(stroke),有些则两者都有
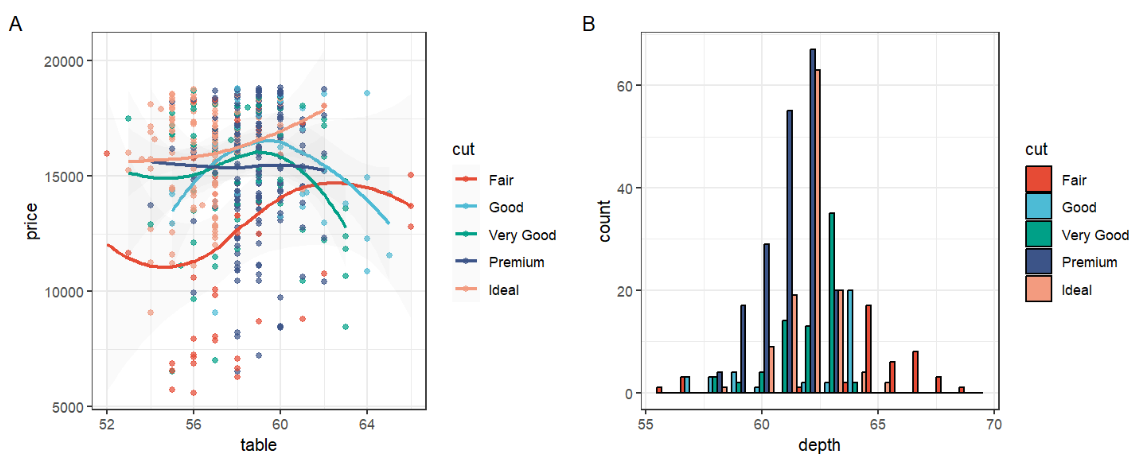
拓展:ggsci包–论文发表用的色板
if(!require("ggsci", quietly = T))
{
  install.packages("ggsci");
  library("ggsci");
}
先创建两张图:
if(!require("gridExtra", quietly = T))
{
  install.packages("gridExtra");
  library("gridExtra");
}
data("diamonds");
(p1 <- ggplot(
  subset(diamonds, carat >= 2.2),
  aes(x = table, y = price, colour = cut)
) +
  geom_point(alpha = 0.7) +
  geom_smooth(method = "loess", alpha = 0.05, size = 1, span = 1) +
  theme_bw() + labs( tag = "A" ));
(p2 <- ggplot(
  subset(diamonds, carat > 2.2 & depth > 55 & depth < 70),
  aes(x = depth, fill = cut)
) +
  geom_histogram(colour = "black", binwidth = 1, position = "dodge") +
  theme_bw() + labs( tag = "B" ));

使用ggsci包中的scale_color_npg函数修改颜色:
p1_npg <- p1 + scale_color_npg()
p2_npg <- p2 + scale_fill_npg()
grid.arrange(p1_npg, p2_npg, ncol = 2)
size
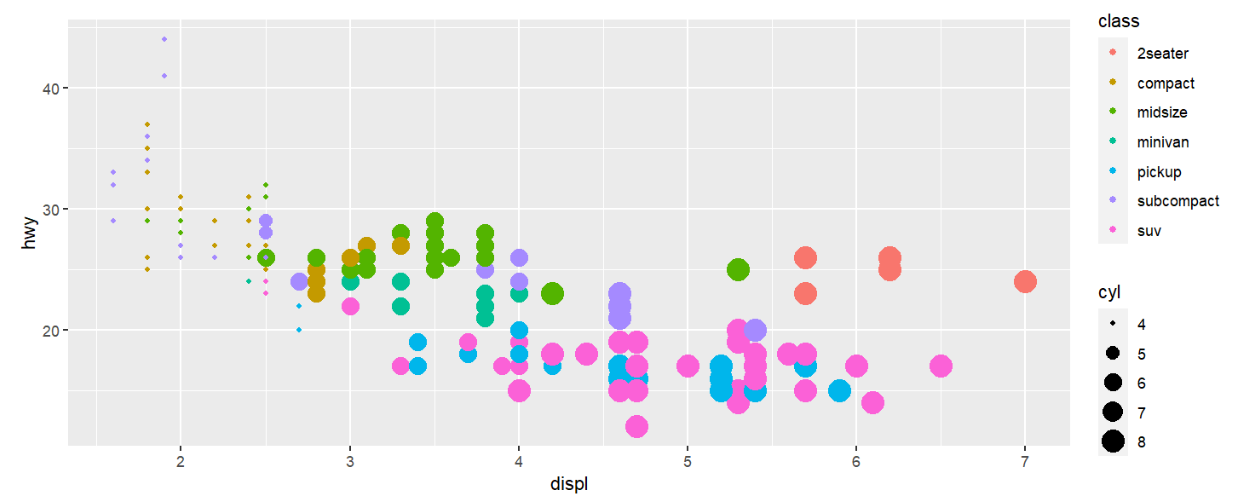
aes(size=列名)表示根据指定列决定点的大小
mpg %>%
  ggplot( aes(displ, hwy) ) +
  geom_point(
    aes( size = cyl,  # cyl列值决定点大小
         colour = class  # 点颜色由class列决定
         ) );
shape
aes(shape=列名)表示根据指定列决定点的大小
mpg %>%
  ggplot( aes(displ, hwy) ) +
  geom_point(
    aes( size = cyl,  # cyl列值决定点大小
         colour = class,  # 点颜色由class列决定
         shape = class  # class列决定点形状
         ) );

总结:size、color等参数可在aes()内部,也可在外部,有什么区别?
-
在内部时,以指定列的值确定大小、颜色等,或按指定factor的数量确定颜色、形状的数量
-
在外部时,则以指定的具体值为准
mpg %>%
  ggplot( aes(displ, hwy) ) +
  geom_point(
    size = 2,  # 点的大小为2
    colour = "green",  # 颜色为绿色
    shape = 21  # 形状为21号点
  );
可以看到所有点的大小、颜色、形状都相同
可以这样理解:size、color等参数接收的值,长度要么为1(指一个具体值,如2、'green'),要么与行数等长(一个factor或数据列)
xy轴
为方便说明,这里只以x轴为例,y轴与x轴调整方式相同,把函数中的x换成y即可
scale_x_continuous(),适用于连续变量的坐标轴
-
name坐标轴名称,即坐标轴表示的是什么数据、使用什么单位等 -
limits坐标轴显示数据范围 -
breaks坐标轴刻度标签,即粗网格线,当设为NULL时无刻度 -
minor_breaks细网格线对应位置,细网格线没有标签 -
labels坐标轴刻度标签内容,默认等于breaks,是实际显示的刻度标签 -
position坐标轴显示位置。x轴为”left”和”right”,y轴为”top”和”bottom” -
trans坐标轴变换函数,自带有”log10”、”exp”、”log2”等值 -
expand扩展坐标轴显示范围
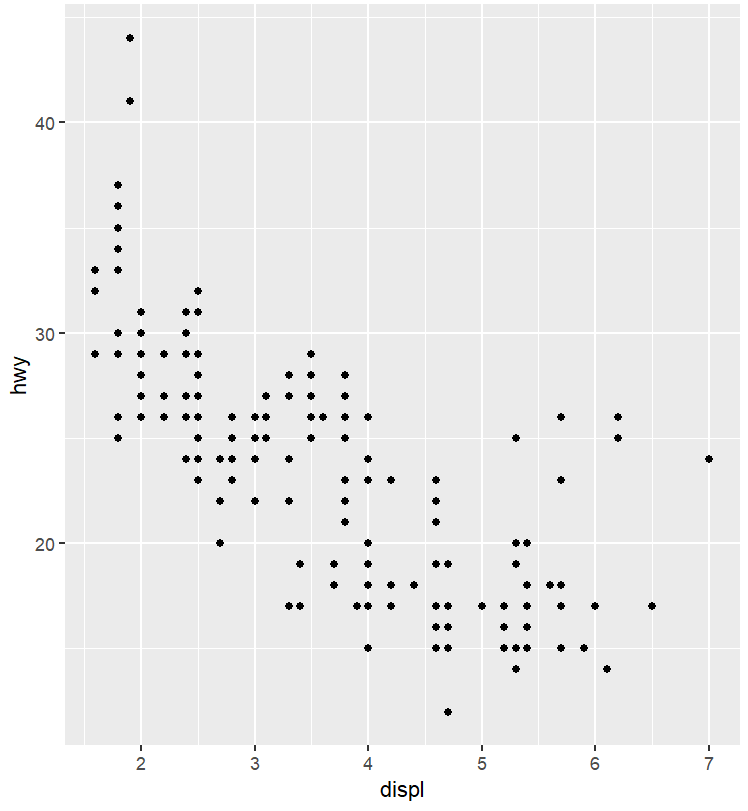
例:先画基础图
(p1 <- ggplot(mpg, aes(displ, hwy)) +
  geom_point());
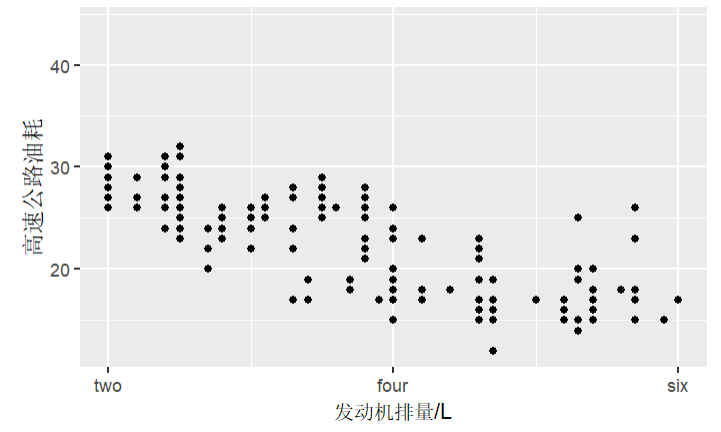
p1 +
  scale_x_continuous(
    name = "发动机排量/L",  # 坐标轴名称
    limits = c(2,6),  # 只显示区间(2, 6)范围的元素
    breaks = c(2, 4, 6),  # 粗网格线
    minor_breaks = c(3, 5),  # 细网格线
    labels = c("two", "four", "six")  # 刻度标签
  ) +
  scale_y_continuous(name = "高速公路油耗" );  # 坐标轴名称
变换坐标轴:
-
scale_x_log10()相当于上面scale_x_continuous函数指定参数trans="log10" -
scale_x_sqrt()相当于trans="sqrt" -
scale_x_reverse()相当于trans="reverse"
注意:它们与scale_x_continuous都只适用于连续变量
p1 +
  scale_x_reverse(
    name = "发动机排量/L",  # 坐标轴名称
    limits = c(6, 2),  # 只显示区间(2, 6)范围的元素
    breaks = c(6, 4, 2),  # 粗网格线
    minor_breaks = c(5, 3),  # 细网格线
    labels = c("six", "four", "two")  # 刻度标签
  );
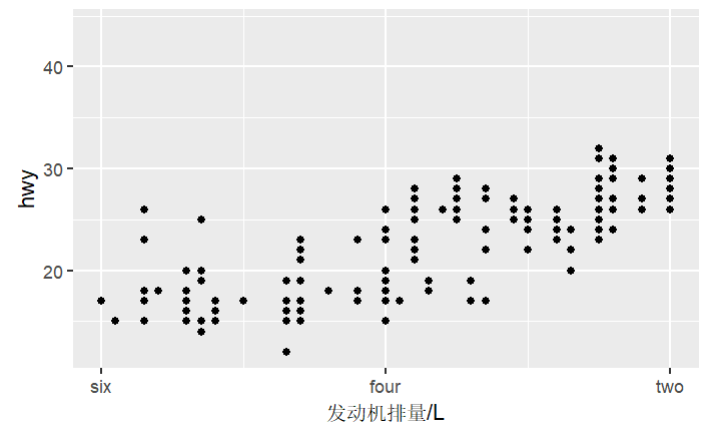
注意:当反转坐标轴时,要同步将limits等参数的区间设置反转,否则不会正确显示数据
scale_x_discrete(),适用于离散变量的坐标轴,参数类似于scale_x_continuous
-
name坐标轴名称,即坐标轴表示的是什么数据、使用什么单位等 -
limits坐标轴显示的数据 -
breaks坐标轴刻度标签,即粗网格线,当设为NULL时无刻度 -
labels坐标轴刻度标签内容,默认等于breaks,是实际显示的刻度标签
例:先画基础图
(p1 <- ggplot(Loblolly, aes(x = Seed, y = height)) +
  geom_boxplot(fill = "cyan"));
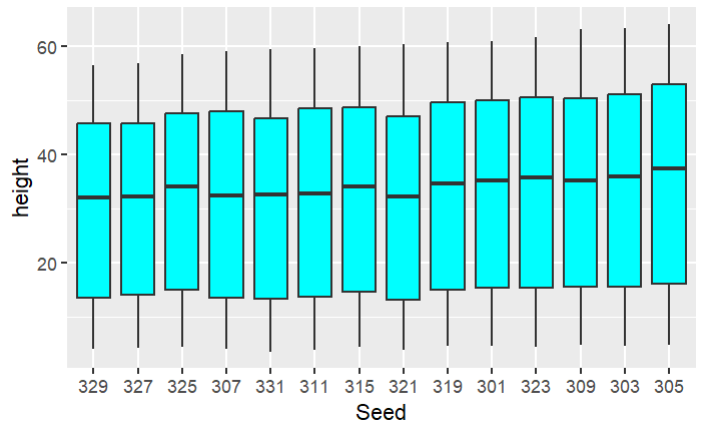
现要反转x坐标轴,不能使用scale_x_reverse,因为它只能用于连续变量,而上图的x轴为离散变量
ggplot(Loblolly, aes(x = Seed, y = height)) +
  geom_boxplot(fill = "orange") +
  scale_x_discrete(limits = rev(levels(Loblolly$Seed)));
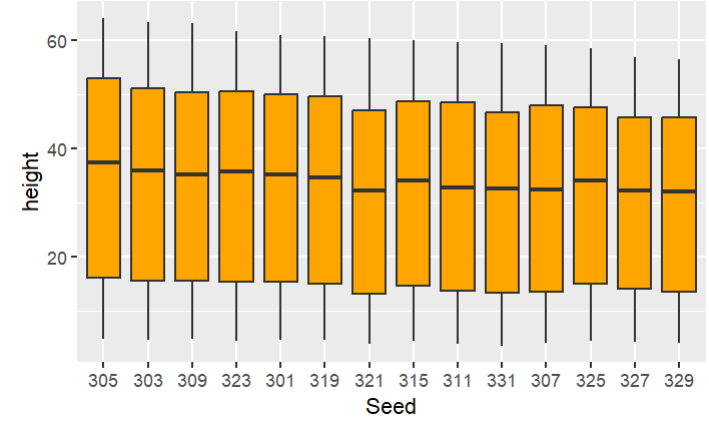
注意:因为Loblolly$Seed是一个factor,所以在反转它时,要使用rev(levels(Loblolly$Seed))而不是rev(Loblolly$Seed),后者会将Loblolly$Seed按数值大小重新排序,而不是将原本的levels顺序逆序
坐标系统
线性坐标系统
coord_cartesian():默认的坐标系统,可使用xlim、ylim等参数,指定xy轴范围,进而实现缩放局部的效果
(p1 <- ggplot(mpg, aes(displ, hwy)) +
  geom_point() +
  geom_smooth());

现在想要放大x轴上4-6、y轴上10-30的部分:
p1 +
  coord_cartesian(xlim = c(4, 6), ylim = c(10, 30));

其实就是改变了xy轴的刻度范围,刻度范围小了,图就放大了
coord_flip()交换xy轴
ggplot(mpg, aes(displ, cty)) +
  geom_point() +
  geom_smooth() +
  coord_flip();
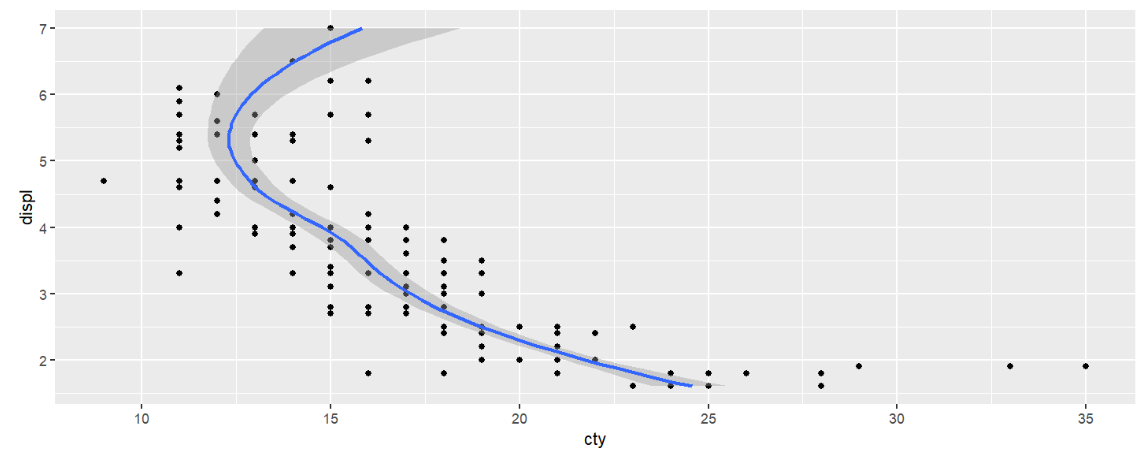
coord_fixed(radio)用特定的长宽比例(ratio)作图。长宽比例:设x轴值每增加1时,刻度向右增加的距离为n;y轴值每增加1时,刻度向上增加的距离为m,则radio=m/n
ggplot(mpg, aes(displ, cty)) +
  geom_point() +
  geom_smooth() +
  coord_fixed(ratio = 1);
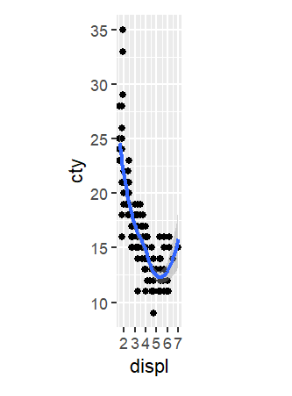
可以看到x轴总长度(≈7)大致比y轴相邻两刻度间距(=5)略长
非线性坐标系统
coord_trans()改变xy轴刻度,并配合使用limx、limy限制xy轴的显示范围
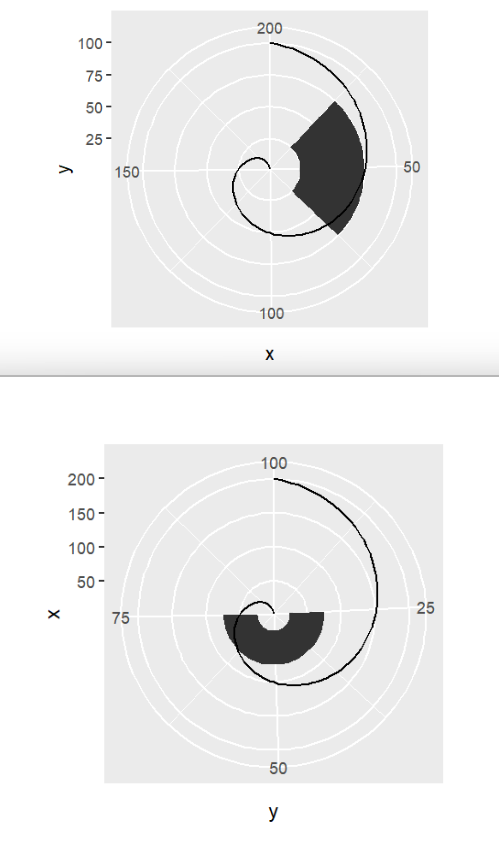
例:先用正常的xy轴画出一条线和一个矩形
rect <- data.frame(x = 50, y = 50)
line <- data.frame(x = c(1, 200), y = c(100, 1))
(base <- ggplot(mapping = aes(x, y)) +
  geom_tile(data = rect, aes(width = 50, height = 50)) +
  geom_line(data = line));

将y轴取log10:
base + coord_trans(y = "log10");

coord_polar()将指定的轴变为圆形,画极坐标图
base + coord_polar();  # 默认为 coord_polar("x")
base + coord_polar("y");
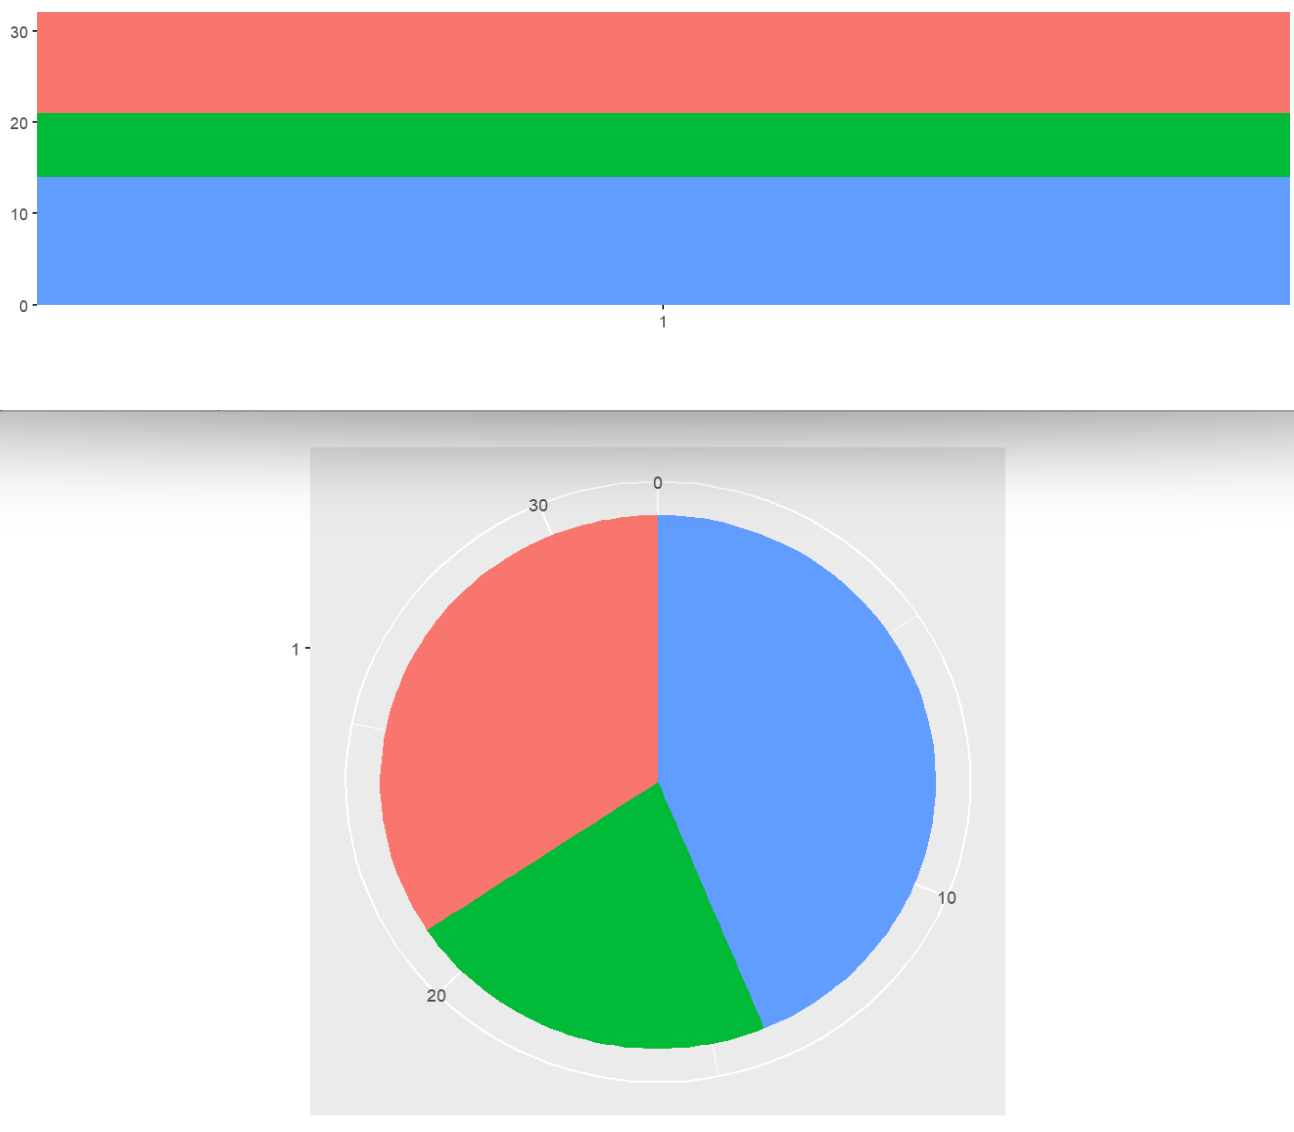
还可以用于将柱形图变成饼图:
(base <- ggplot(mtcars, aes(factor(1), fill = factor(cyl))) +
  geom_bar(width = 1) +
  theme(legend.position = "none") +
  scale_x_discrete(NULL, expand = c(0, 0)) +
  scale_y_continuous(NULL, expand = c(0, 0)));
base + coord_polar(theta = "y");  # 变饼图
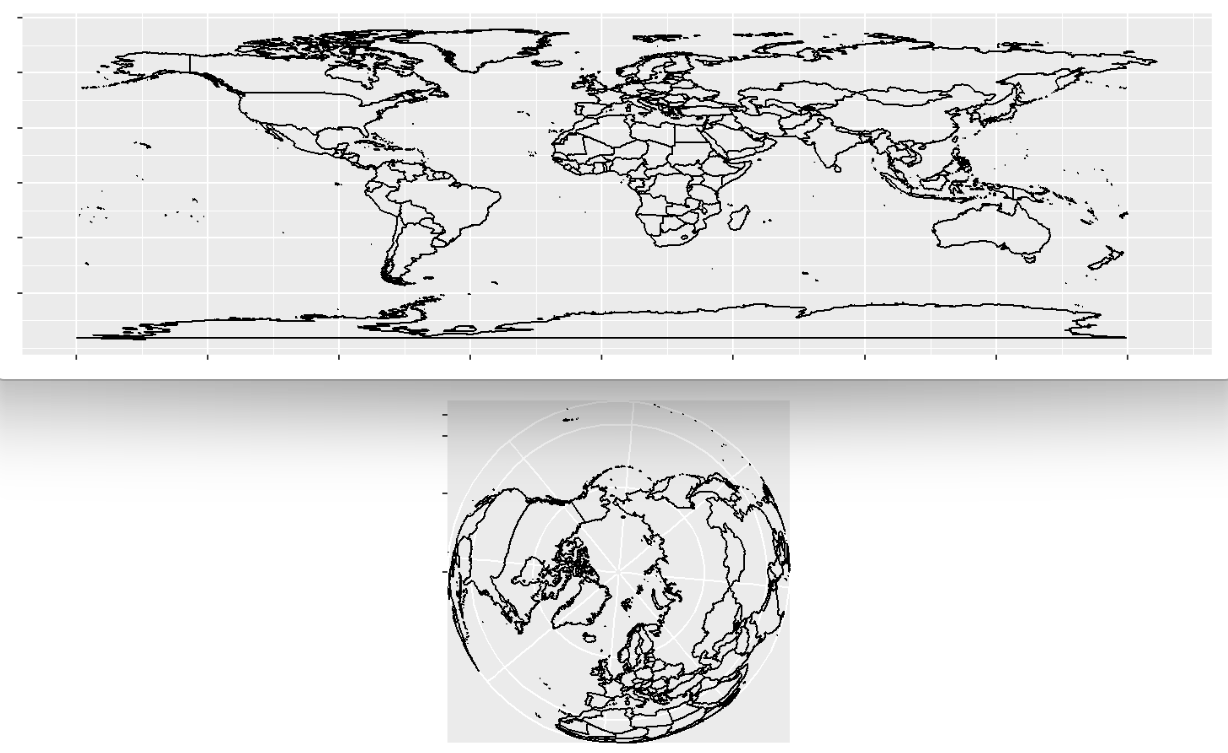
coord_map()用于将矩形地图变成圆形的
world <- map_data("world")
(worldmap <- ggplot(world, aes(long, lat, group = group)) +
  geom_path() +
  scale_y_continuous(NULL, breaks = (-2:3) * 30, labels = NULL) +
  scale_x_continuous(NULL, breaks = (-4:4) * 45, labels = NULL));
if(!require("mapproj", quietly = T))
{
  install.packages("mapproj");
  library("mapproj");
}
worldmap + coord_map("ortho");
faceting画子图
facet_grid(by_row ~ by_col)按by_col列分成多列,或按by_row列分成多行,之后每行/每列画一个子图
ggplot( mtcars, aes( x = wt, y = mpg ) ) +
  geom_point() +
  facet_grid( . ~ cyl, scales = "free" );  # 按cyl分成三列
ggplot( mtcars, aes( x = wt, y = mpg ) ) +
  geom_point() +
  facet_grid( cyl ~ . )  # 按cyl分成三行
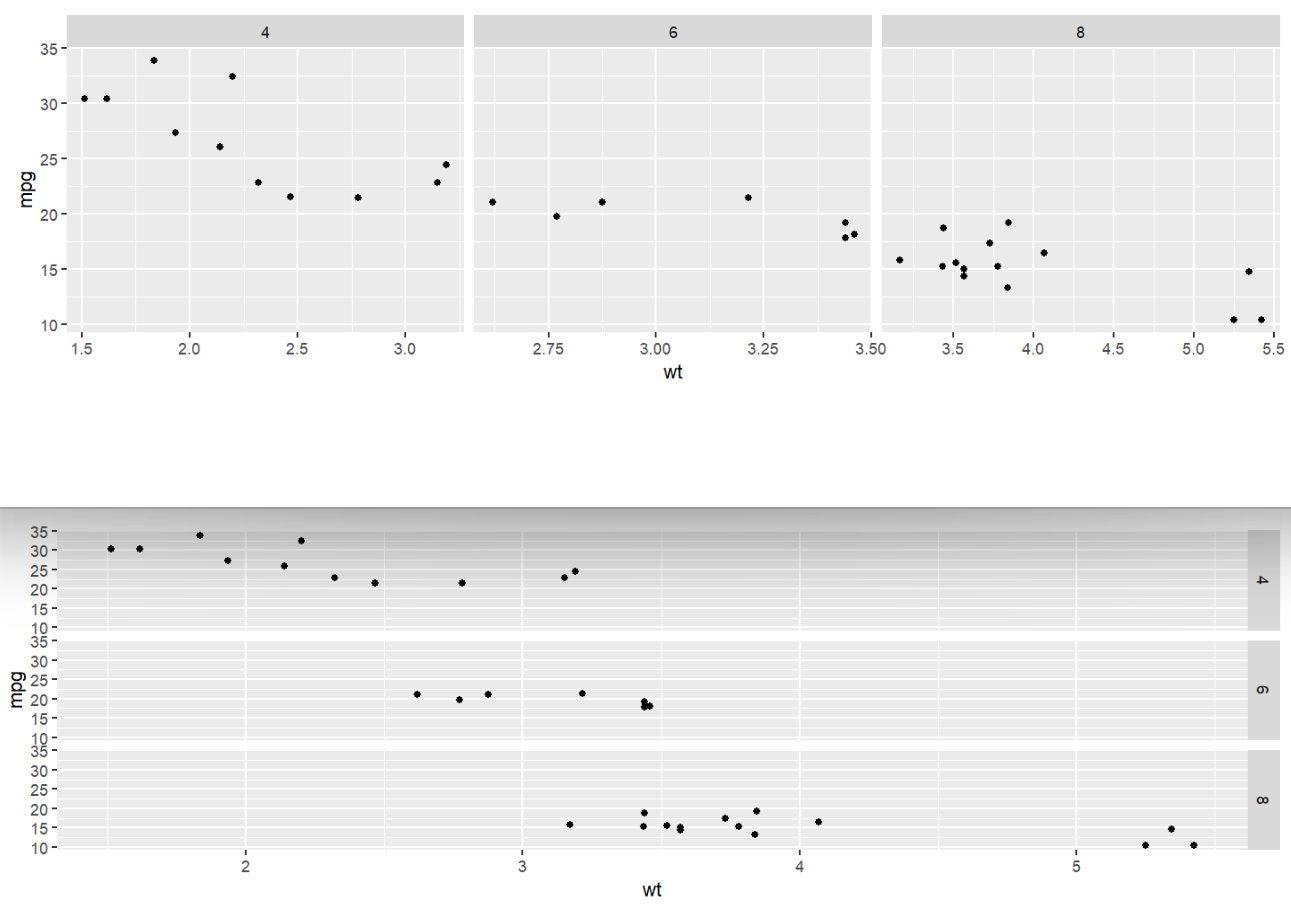
默认情况下,如果指定分成多列,则所有子图有相同的xy范围。可以设置scales = "free"参数,使子图仅有相同的y轴,x轴范围根据每个子图的数据不同。(指定分成多行的情况类似)
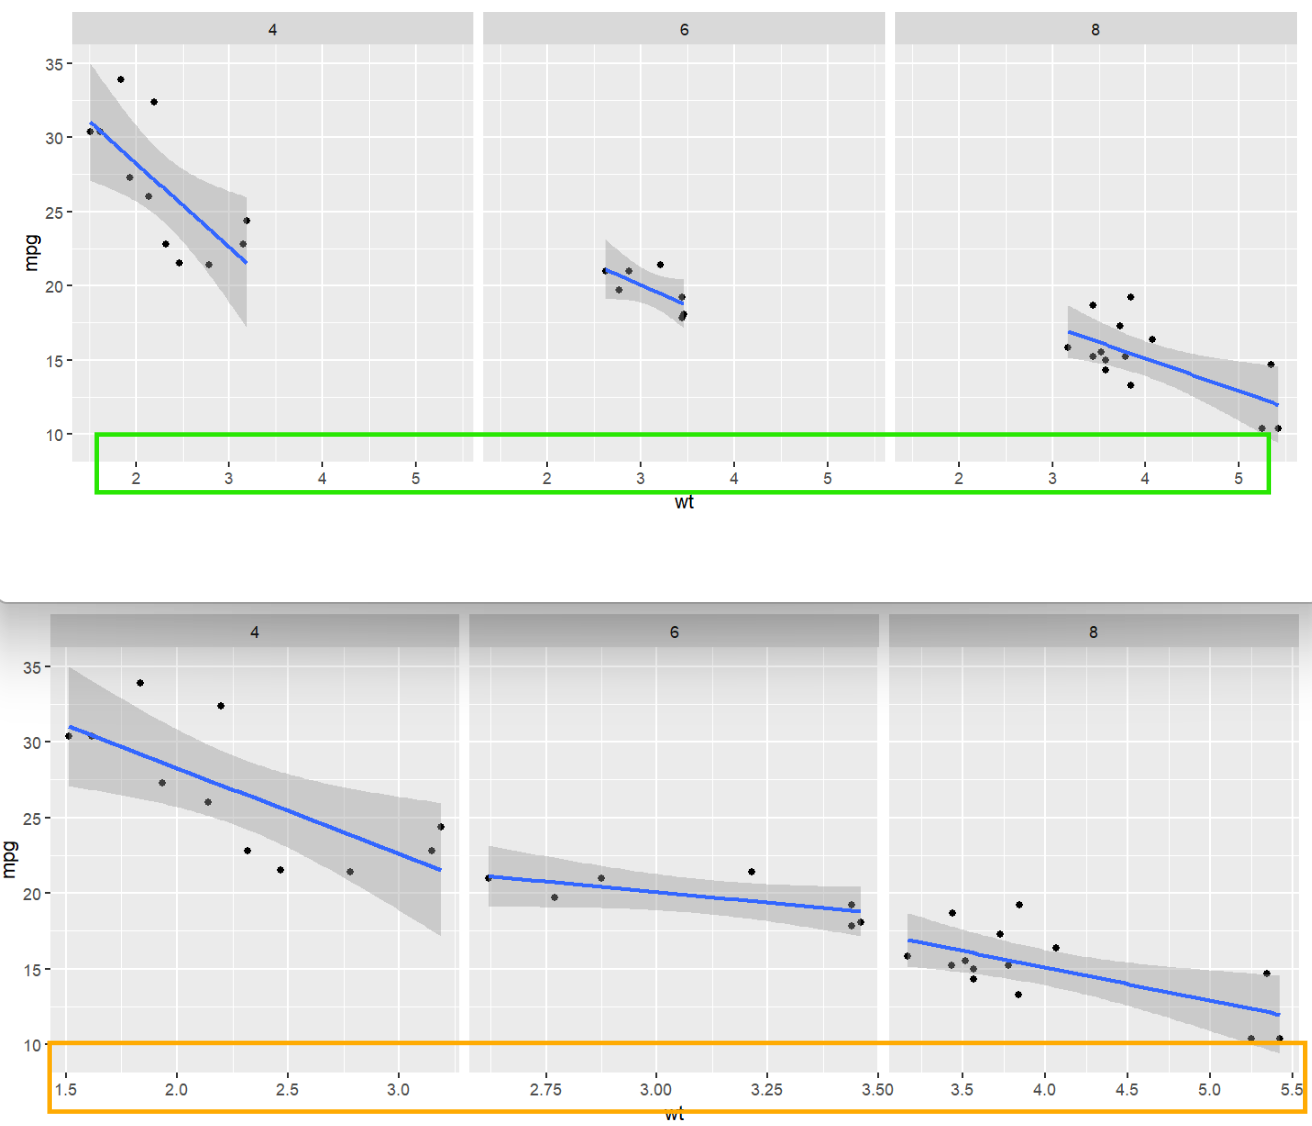
ggplot( mtcars, aes( x = wt, y = mpg ) ) +
  geom_point() +
  geom_smooth( method = "lm" ) +  # 向散点图中添加拟合曲线
  facet_grid( . ~ cyl );  # 此时x轴是共享的,用同一个x轴
ggplot( mtcars, aes( x = wt, y = mpg ) ) +
  geom_point() +
  geom_smooth( method = "lm" ) +
  facet_grid( . ~ cyl, scales = "free");  # 根据每张图的数据范围确定x轴范围
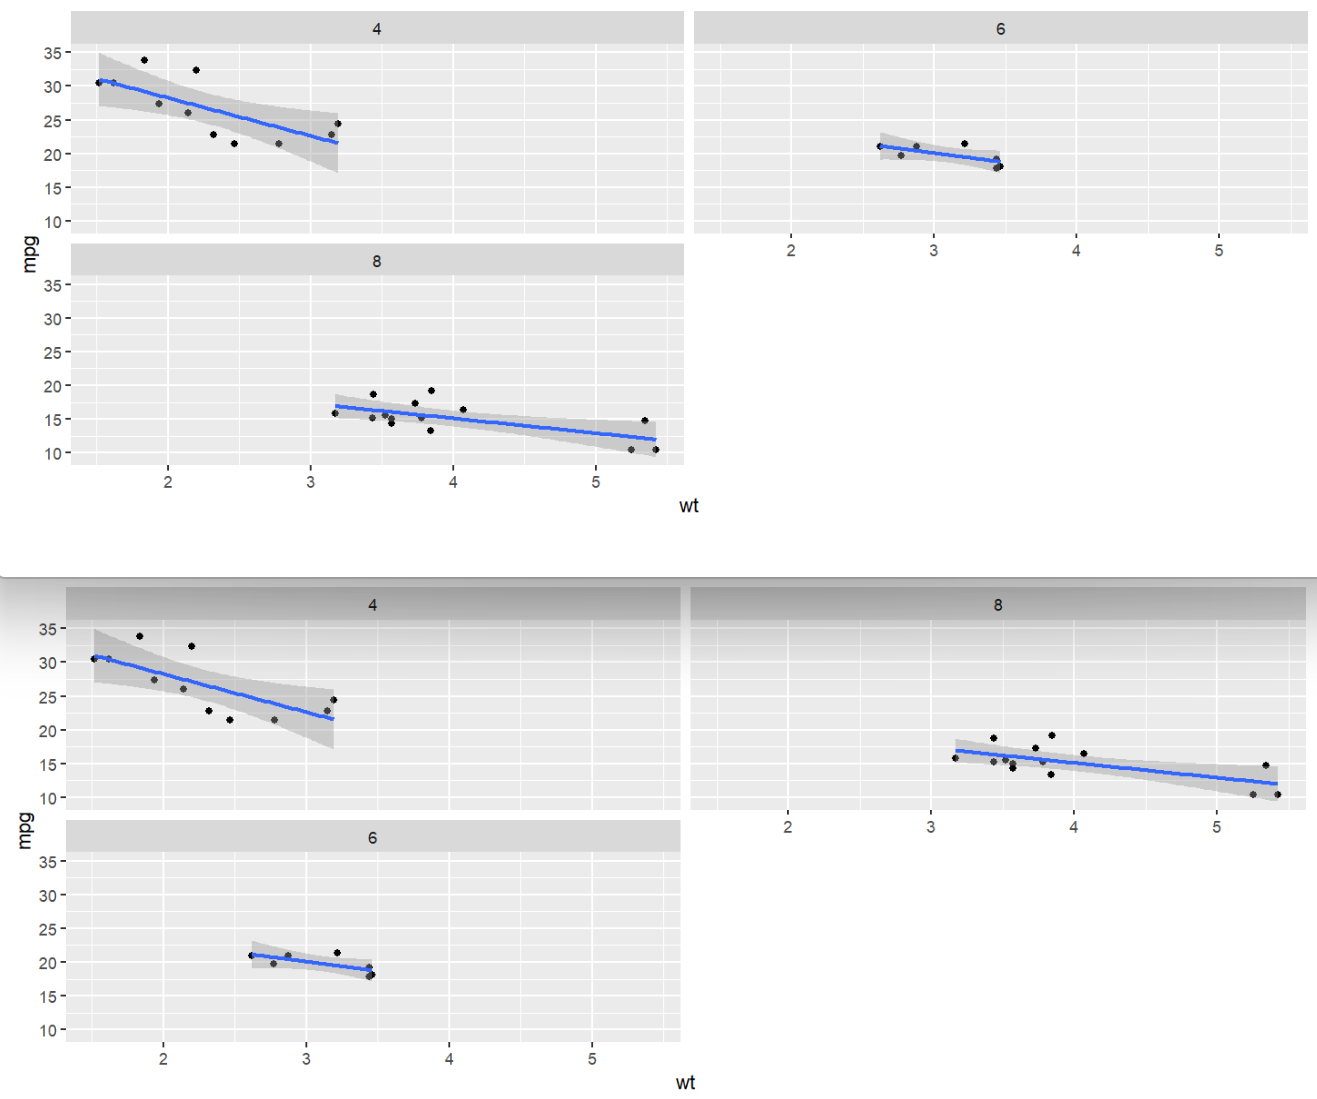
facet_wrap(by_row ~ by_col, ncol, nrow)与前面facet_grid类似,都是按指定列画子图,不同的是,它可以指定画成几列/行,让每列/行有多个图
ggplot( mtcars, aes( x = wt, y = mpg ) ) +
  geom_point() +
  geom_smooth( method = "lm" ) +
  facet_wrap( . ~ cyl , ncol = 2);  # 共有两列
  # 也可以写成:
  # facet_wrap( cyl ~ . , ncol = 2);
ggplot( mtcars, aes( x = wt, y = mpg ) ) +
  geom_point() + geom_smooth( method = "lm" ) +
  facet_wrap( . ~ cyl , ncol = 2, dir = "v" );  # dir指定第二个子图是往下还是往右画,默认往右
统计与绘图
基本统计类生成函数
正态分布:norm系列函数
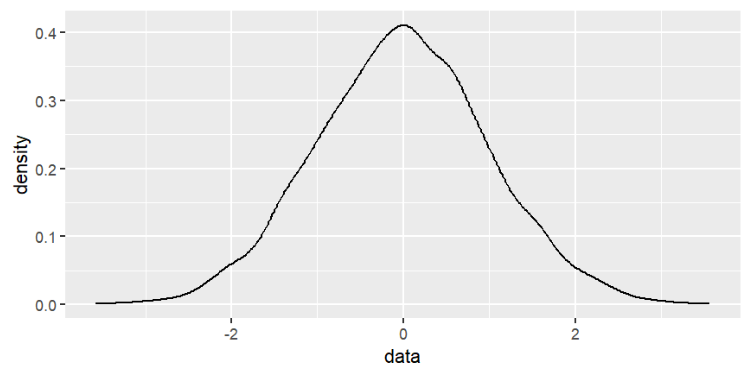
rnorm(10000, mean = 0, sd = 1)生成10000个平均值为0、标准差为1的数据(标准正态分布)
-
(mean + 1 * sd)包含68%的数据 -
(mean + 2 * sd)包含95%的数据 -
(mean + 3 * sd)包含99%的数据
x <- rnorm(10000, mean = 0, sd = 1);
ggplot( data.frame( data = x ), aes( data ) ) +
  geom_density();  # 密度图--显示数据的分布情况
其它norm系列函数:
-
dnorm(x, mean, sd)正态分布的概率密度函数(pdf) -
pnorm(x, mean, sd)正态分布的累积密度函数(cdf) -
qnorm(x, mean, sd)正态分布的逆累积密度函数
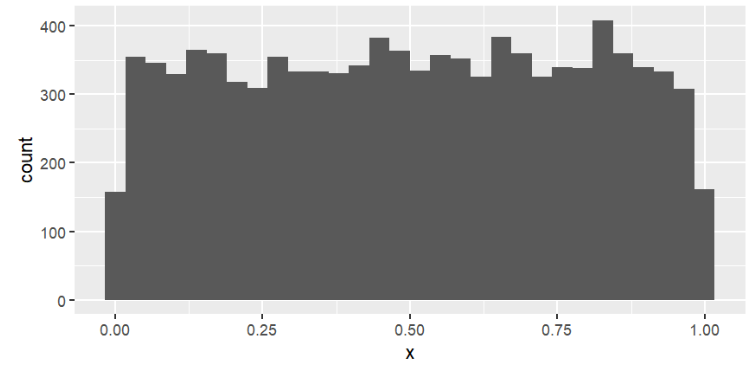
均匀分布:runif(10000, min = 0, max = 1)生成10000个均匀分布在0-1间的数据
x <- runif( 10000 );  # 默认均匀分布在0-1
ggplot( data.frame( dat = x ), aes( x ) ) +
  geom_histogram();  # 直方图--显示各区间的数据多少
其它统计类生成函数:
-
rbinom(x, 试验次数size, 每次试验的成功概率prob)二项式分布 -
rpois(n, lambda)泊松分布,体现在特定时间内发生n个事件的概率 -
rexp(n, rate)指数分布,体现一个随机事件发生需要的时间 -
rgamma(n, shape)伽马分布,体现n个随机事件都发生需要的时间
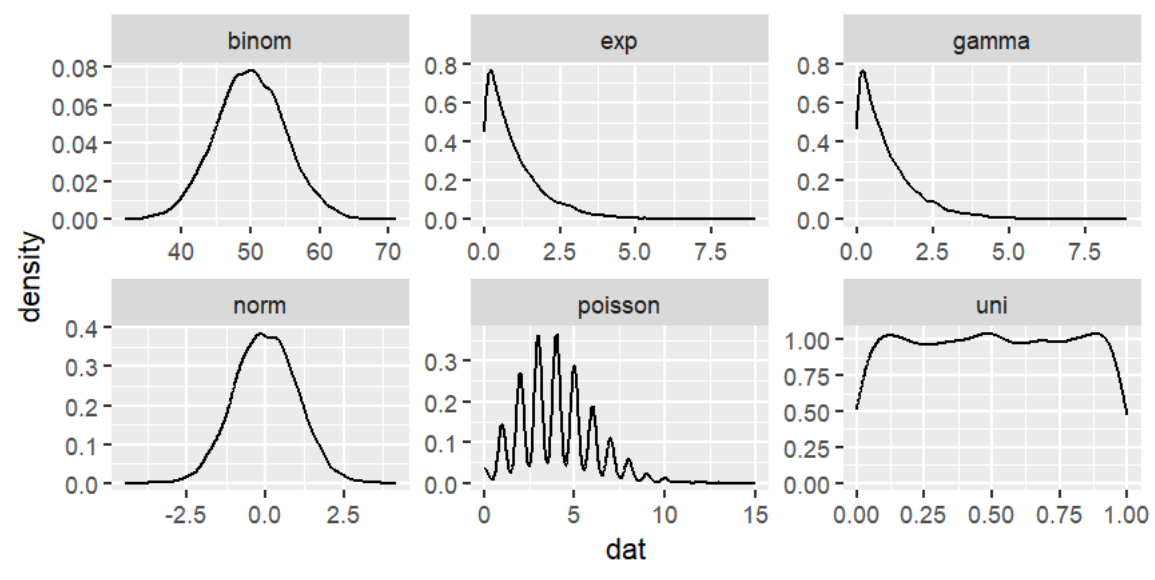
将它们绘制出来:
n <- 10000;
uni <- tibble( dat = runif(n), type = "uni" );
norm <- tibble( dat = rnorm(n), type = "norm" );
binom <- tibble( dat = rbinom(n, size = 100, prob = 0.5), type = "binom" );
poisson <- tibble( dat = rpois(n, lambda = 4), type = "poisson" );
exp <- tibble( dat = rexp(n, rate = 1) , type = "exp");
gamma <- tibble( dat = rgamma(n, shape = 1) , type = "gamma");
combined <- bind_rows( uni, norm, binom, poisson, exp, gamma );
ggplot( combined , aes( dat ) ) + geom_density() +
      facet_wrap( ~type, ncol = 3, scales = "free");
常用量化描述函数
-
mean平均值 -
median中值 -
sd标准差 -
var样本方差
-
range最大值和最小值 -
quantile分位值 -
summary(data)-
当data为数值型数组时:计算最大最小值、1/3分位值、平均值、中值
-
字符型数组:长度、类型
-
num <- c(1, 2, 3, 3, 4, 5, 5);
str <- c("uni", "norm", "binom", "poisson", "exp", "gamma");
mean(num);  # 3.285714
median(num);  # 3
sd(num);  # 1.496026
var(num);  # 2.238095
range(num);  # 1 5
quantile(num);#分位值
  0%  25%  50%  75% 100%
 1.0  2.5  3.0  4.5  5.0
summary(num);
   Min. 1st Qu.  Median    Mean 3rd Qu.    Max.
  1.000   2.500   3.000   3.286   4.500   5.000
summary(str);
   Length     Class      Mode
        6 character character
quantile还能指定计算哪几个分位点
quantile(num, probs = seq(0, 1, length = 11));
表示计算0%-100%之间共11个分位点,即每隔10%计算一次
  0%  10%  20%  30%  40%  50%  60%  70%  80%  90% 100%
 1.0  1.6  2.2  2.8  3.0  3.0  3.6  4.2  4.8  5.0  5.0
table函数:数组中有哪些值和它们的出现次数
num <- c(1, 2, 3, 3, 4, 5, 5);
table(num);
num
1 2 3 4 5
1 1 2 1 2
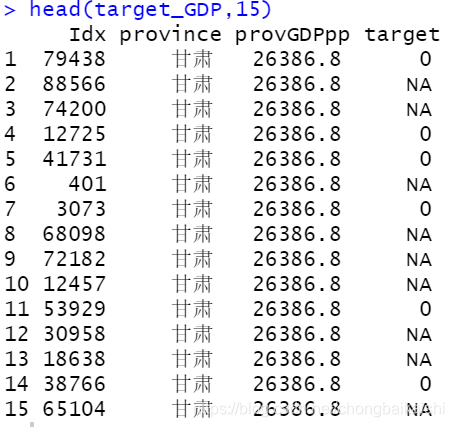
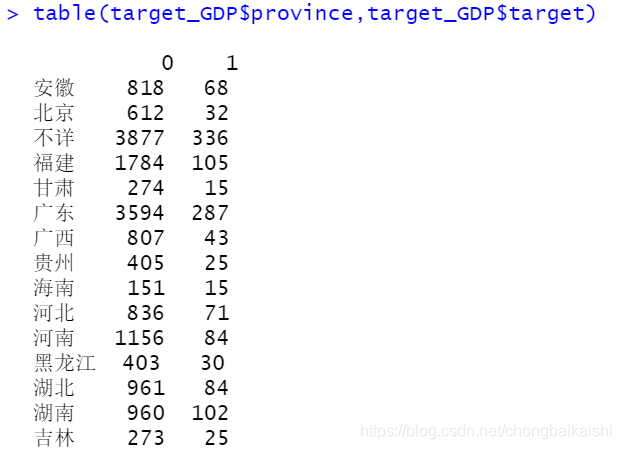
也可以接收一个df:table(df$a, df$b)先按a列分组,再计算每组中b列中每个值的出现数量,默认按第一列分组
count相关函数:
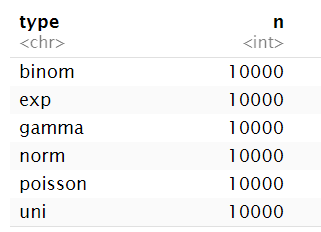
dplyr::count(data, 分组列)现按分组列分组,之后计算每组的数量(其实就是分组列中各元素数量)
例:使用基本统计类生成函数最后面创建的combineddf
# 这两种方法结果相同
combined %>% count( type );
combined %>% group_by(type) %>% count();
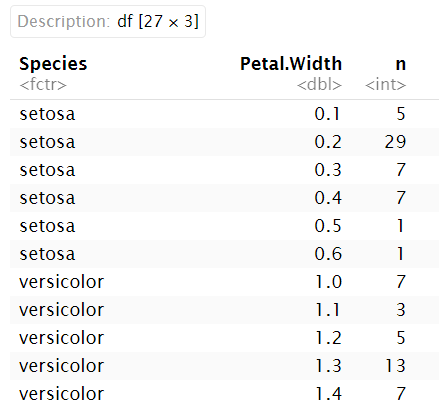
可以有多个分组列:
# 这两种方法结果相同
iris %>%
  group_by(Species) %>%
  count(Petal.Width);
iris %>% count(Species, Petal.Width);
各种数据及所画的图
数值+分组–箱型图
即一列是数值,另一列是分组信息的数据
data.fig3a <- read_csv( file = "r-data/nc2015_data_for_fig3a.csv" );  # 读取数据
head( data.fig3a[ c("tai", "trans.at") ] );  # 只显示有用的两列
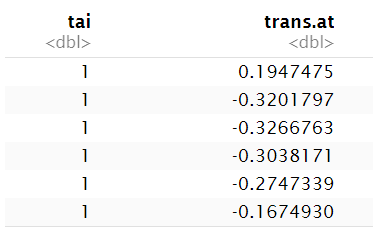
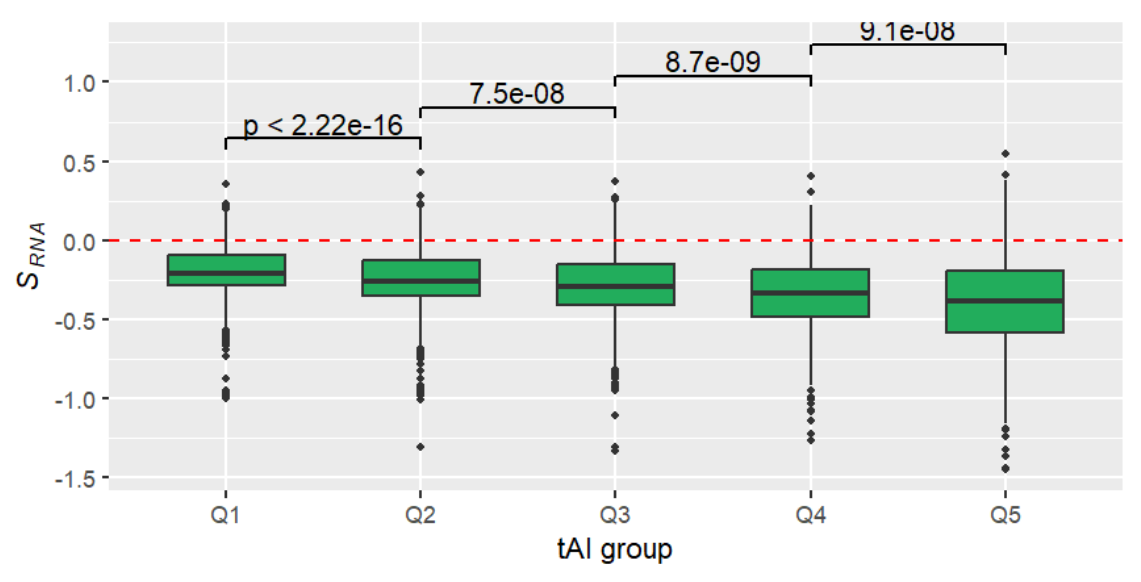
-
tai:基因表达量的一种计算方式,从1到5表达量逐渐升高 -
trans.at:基因中A碱基数量减去T碱基数量
假设:A的在生物体内的合成成本高于T,因此高表达基因在可能的情况下倾向于使用T而不是A。因此,在高表达的基因当中,A-T的差值trans.at会变大(更负)
为了验证这个假设,需要画箱型图geom_boxplot
x轴数据为tai,y轴数据为trans.at
注意:我们需要每个tai都画一个箱型图,此时需要factor(tai),类似于分组操作;如果直接输入tai,则只能画出一个箱型图(包含所有的数据)
fig3a <-
   ggplot( data.fig3a, aes( factor(tai), trans.at ) ) +  # 输入数据
   geom_boxplot( fill = "#22AD5C", linetype = 1 ,outlier.size = 1, width = 0.6) +  # 画箱型图
   xlab( "tAI group" ) +  # x轴标签
   ylab( expression( paste( italic(S[RNA]) ) ) ) +  # y轴标签
   scale_x_discrete(breaks= 1:5 , labels= paste("Q", 1:5, sep = "") ) +  # 指定x轴标签
   geom_hline( yintercept = 0, colour = "red", linetype = 2);  # 在y=0的位置添加标注线
fig3a;
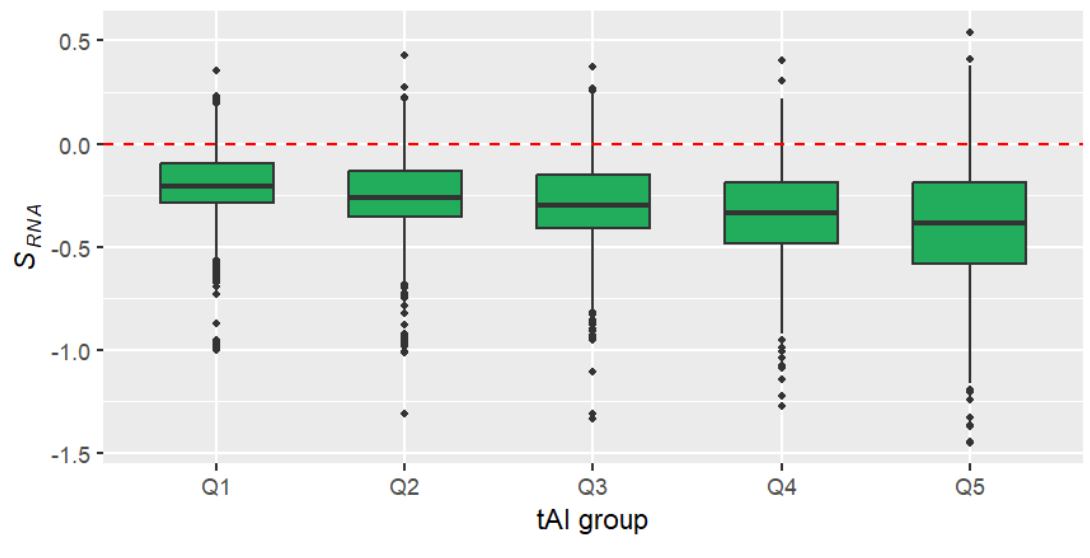
一般情况下,我们只看中值的变化趋势,即箱型图最中间的那条线,可以看到从Q1->Q5trans.at中值依次下降,说明假设是正确的
也可增加Q1-Q5之间的差异分析来辅助说明假设正确性
使用geom_signif包:
if (!require("geom_signif")){
  install.packages("geom_signif");
  library("geom_signif");
}
fig3a + geom_signif(
  comparisons = list(1:2, 2:3, 3:4, 4:5),   # 第1和2组数据比较、第2和3组数据比较...
  test = wilcox.test,  # 检测方法
  step_increase = 0.1 );  # 让结果数值分开(下一组比上一组结果高0.1个单位)
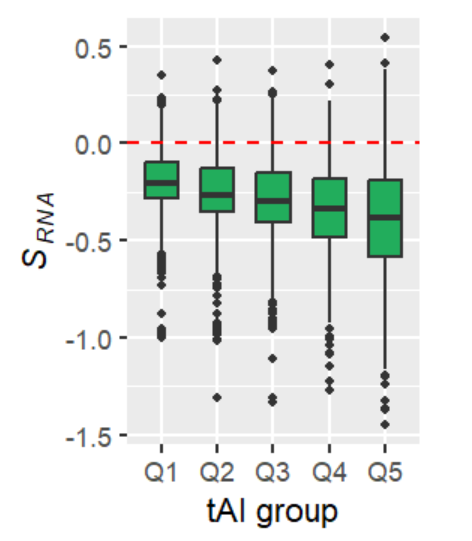
一般情况下,我们画出的箱型图要高瘦,而不要矮胖。可以使用Rmd中代码框自带的fig.height/fig.width属性修改:
{r fig.height=2.5, fig.width=2}
fig3a;  # 更改fig.height/fig.width的值
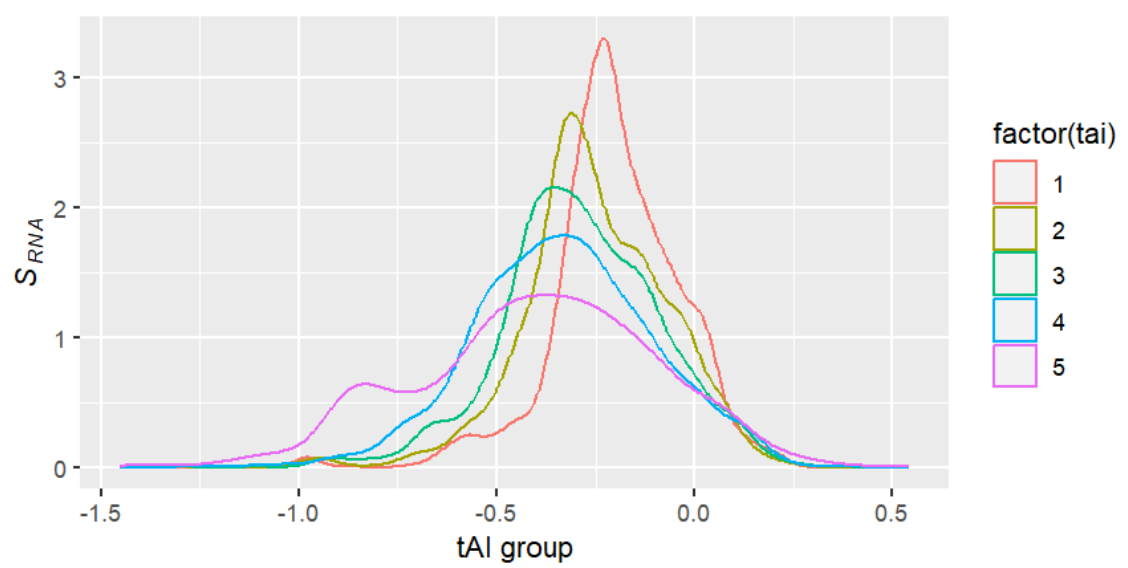
这种数据也可以使用直方图(density plot),但在此例中不如箱型图
ggplot( data.fig3a, aes( trans.at, colour = factor(tai) ) ) +
  geom_density( ) +  # 直方图
  xlab( "tAI group" ) +
  ylab( expression( paste( italic(S[RNA]) ) ) );
多组数值–散点图
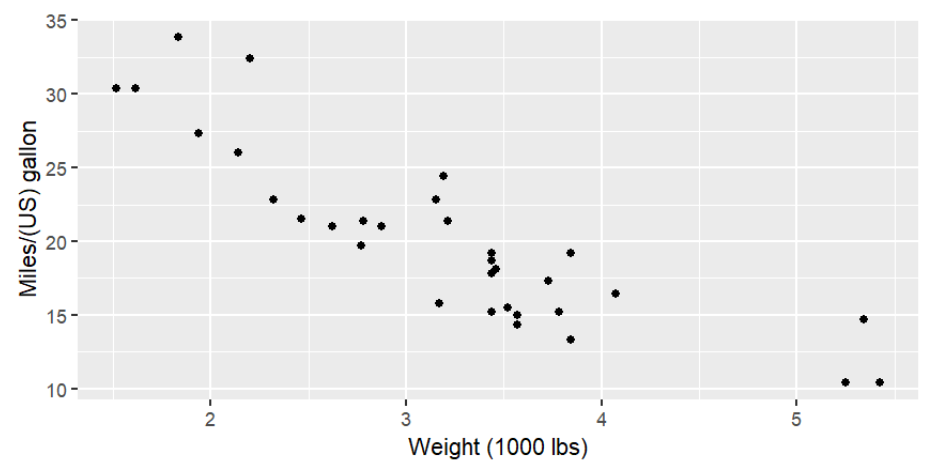
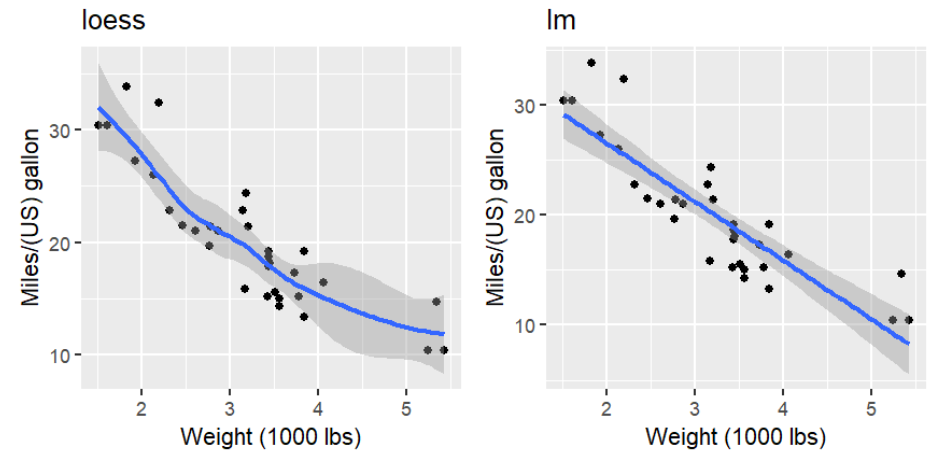
即有两列或多列为数值型的数据,通常我们想要知道两组数据间的关系,或者说一组数据受另一组数据的影响
以mtcars为例:

查看重量wt与燃油效率mpg之间的关系:
plotcars <-
  ggplot( mtcars, aes( x = wt, y = mpg ) ) +
  geom_point() +
  xlab( "Weight (1000 lbs)" ) +
  ylab( "Miles/(US) gallon" );
plotcars;
使用geom_smooth添加拟合线:
loess <- plotcars + geom_smooth() +  # 拟合曲线(默认值)
  ggtitle("loess");
lm <- plotcars + geom_smooth( method = "lm" ) +  # 线性回归(直线)
  ggtitle("lm");
if (!require("cowplot")){
  install.packages("cowplot");
  library("cowplot");
}
cowplot::plot_grid(loess, lm, ncol=2);
多组数值–箱型图
当趋势不明显时,可以按另一组数据分组
通常有两种分组方法:
-
等距分组(equal-distance binning):取最大最小值,分为多个距离相等的区间,把数据值在相同区间的行分为1组
-
等频分组(equal-size binning):确保每组的数量相同,每组的距离不一定相等
等频分组使用ntile(data, n),表示将数据分成n组,每组的数据量相同
等距分组使用cut(data, break),breaks接收一个数字型vector(a,b,c...),表示按(a-b]、(b-c]、(c-…]进行分组
注意cut函数不仅用于等距分组,还可以指定任意距离进行分组。更多关于cut函数
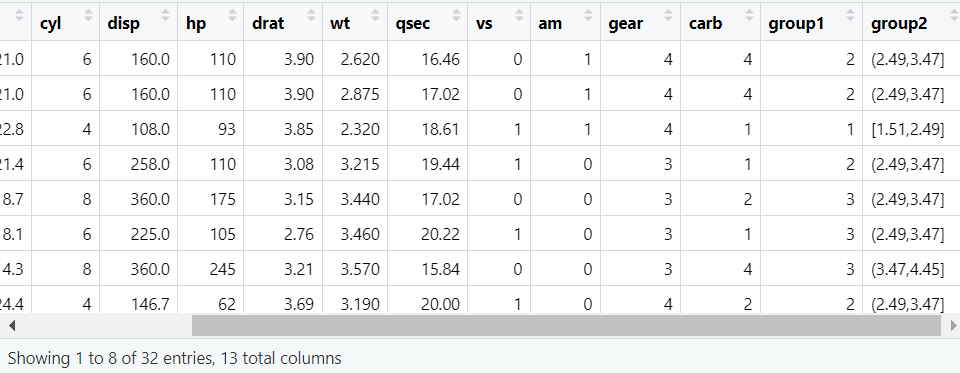
mtcars2 <- mtcars %>%
   mutate(
     group1 = ntile( wt, 4 ),  # 等频分组
     group2 = cut(
       wt,
       breaks = seq( from = min(wt), to = max(wt), by = (max(wt) - min(wt)) / 4 ),  # 表示平均分成
       include.lowest = T
   )  # 等距分组
);
mtcars2;
等频分组结果:
table( mtcars2$group1 );
1 2 3 4
8 8 8 8
表示共有1234共4组,每组都有8个数据
等距分组结果:
table( mtcars2$group2 );
[1.51,2.49] (2.49,3.47] (3.47,4.45] (4.45,5.42]
          8          13           8           3
第一行是分组的区间,第二行是每组个数,可以看到区间距离相等而每组个数不相等
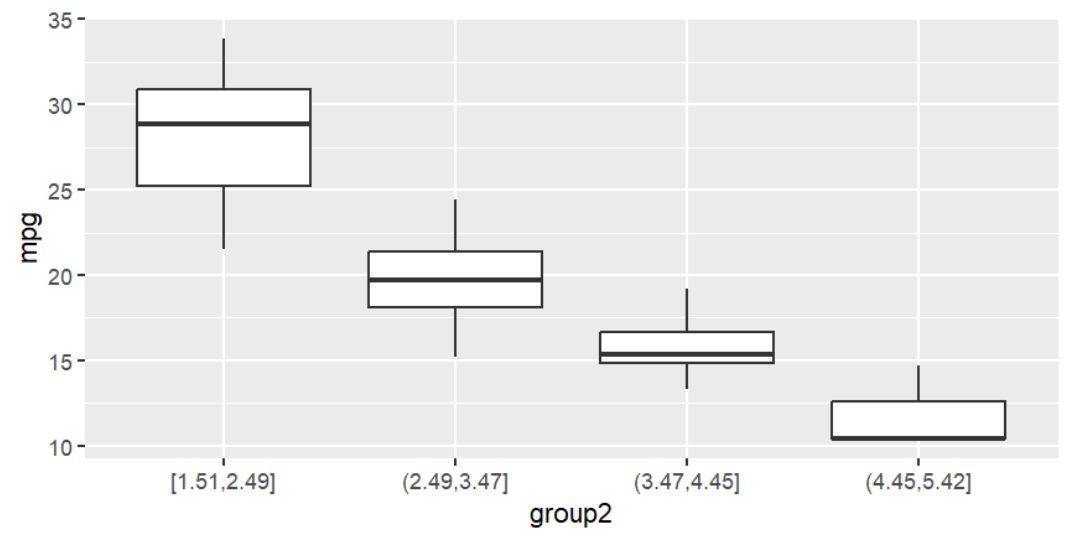
使用箱型图描述分组结果:
ggplot( mtcars2, aes( group2, mpg ) ) +
   geom_boxplot();
统计学中的各种检验
一些统计学概念
零假设(null hypothesis):假定为真的某种假设,通常表达为总体参数等于某个固定值。 例如,“这个群体的平均年龄是50岁”、“这个药物对治疗癌症没有作用”等等
非零假设(alternative hypothesis/non-null hypothesis):零假设的对立。例如零假设是“两组数据没有区别”,非零假设就是“两组数据有区别”
P值(P value);在零假设成立的条件下,观察到当前统计量或更极端统计量的概率,用于评估观察到的数据与零假设下期望的数据之间的差异
较低的P值意味着观察结果与零假设下的期望结果差异很大。通常,如果P值低于预定的显著性水平(如0.05),我们会认为零假设不成立,而非零假设成立
可以简单理解为:基于零假设,观察到某种情况发生的可能性有多大。这个概率越小,零假设错误的可能性就越高
P value summary:是一种简洁的方式来表示P值的大小
-
***: P < 0.001 -
**: 0.001 ≤ P < 0.01 -
*: 0.01 ≤ P < 0.05 -
.: 0.05 ≤ P < 0.1 -
` `(空格): P ≥ 0.1
“一尾”和“双尾”P值:
-
双尾P值
-
如果在做假设检验时,没有预期的方向或者对两个方向都感兴趣,则应进行双尾测试
-
例如,想知道药物A是否与药物B有不同效果(不管是更好还是更差),这个假设包含了两个方向(更好/更差)
-
给出了观察数据在零假设下出现的概率,不考虑方向
-
-
一尾P值
-
当预期了某个方向的效果时,应进行一尾测试
-
例如,想知道药物A是否比药物B更好时(而不是更差)
-
给出了在特定方向上观察到的数据在零假设下出现的概率
-
-
比较
-
一尾P值通常是双尾P值的一半
-
选择一尾还是双尾测试应该基于研究问题和假设,而不是基于数据
-
应谨慎使用一尾测试,因为它更容易发现在预期方向上的效应,但同时更可能忽略另一个方向上的真实效应
-
t值:表示了样本数据与零假设之间的差异大小
自由度(Degrees of Freedom/df):反映数据中可用于估计参数的独立信息量的值,用于确定t值的显著性水平
-
在独立样本T检验中,通常是两个样本的总样本量减去2。例如,如果有两个样本,每个样本有10个观测值,那么df = (10 + 10) - 2 = 18
-
在配对样本或单样本T检验中,自由度是样本量减去1
t-test:常用于检验样本与假设的均值差异。比如单样本时,检验样本均值是否等于某一数值;双样本时,检验两个样本的均值是否相等
要求:两个样本需来自呈正态分布的总体、方差需相等
应用:
-
paired-sample:检验配对的样本之间的均值差异。比如同一组样本的两次测量结果之间的比较,又比如临床试验中两组年龄和性别上不同的样本
-
independent sample:随机的两个样本之间的均值检验。比如检验两个班的月考数学成绩
95%置信区间(95% confidence interval/CI):是一种用于估计未知参数的真实值范围的统计方法。它基于样本数据来估计某个未知参数(如平均值)的值,并给出一个区间(如(1.5, 4.7)),使得这个区间有95%的可能性包含这个未知参数的真实值
应用:理解效应大小的不确定性。如果CI包含了0,这通常意味着该效应在统计上是不显著的(与零假设相符),反之则通常意味着效应是统计显著的
相关系数(correlation coefficient):用于描述两个变量之间的相关程度。一般在[-1, 1]之间,其绝对值越趋近于1,则两个变量相关程度越高。R中常用cor.test()函数计算该值
参数检验
基础概念与数据准备
参数检验(parametric tests):
-
包括:t-test、analysis of variance方差分析、linear regression线性回归等
-
条件:数据有较明确的分布(如正态分布等),或假设数据有明确的分布(当假设不成立时,检测会无效)
-
特点:相比与非参数检验,更灵敏,p-value更低
-
适用于:数量化性状(如身高、体重、产量、污染值等)、整数值(如成绩、年龄、每天步数等)
-
不适用于:百分比或比例、有太多趋向于min/max的数据、count data(一种行为在固定时间内发生的次数)、discrete data(离散数据)
-
要求:
-
随机取样
-
值或残差(residules)为正态分布,残差是指观察值与预测值(mean)之差
-
有相同的方差
-
可能需要的包:psych、rcompanion、FSA、relaimpo
if(!require("psych", quietly = T))
{
  install.packages("psych");
  library("psych");
}
if(!require("rcompanion", quietly = T))
{
  install.packages("rcompanion");
  library("rcompanion");
}
if(!require("FSA", quietly = T))
{
  install.packages("FSA");
  library("FSA");
}
if(!require("relaimpo", quietly = T))
{
  install.packages("relaimpo");
  library("relaimpo");
}
准备数据:
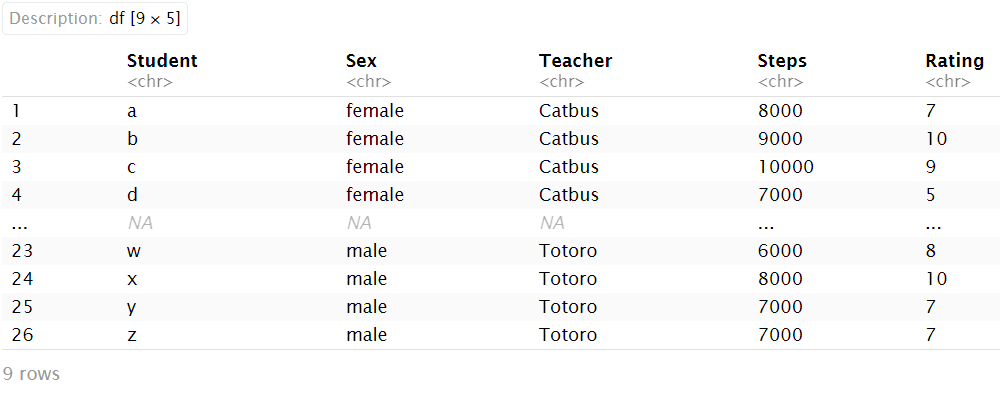
source("data/input_data1.R");
str(Data);
headTail(Data);
'data.frame':	26 obs. of  5 variables:
 $ Student: chr  "a" "b" "c" "d" ...
 $ Sex    : chr  "female" "female" "female" "female" ...
 $ Teacher: chr  "Catbus" "Catbus" "Catbus" "Catbus" ...
 $ Steps  : int  8000 9000 10000 7000 6000 8000 7000 5000 9000 7000 ...
 $ Rating : int  7 10 9 5 4 8 6 5 10 8 ...
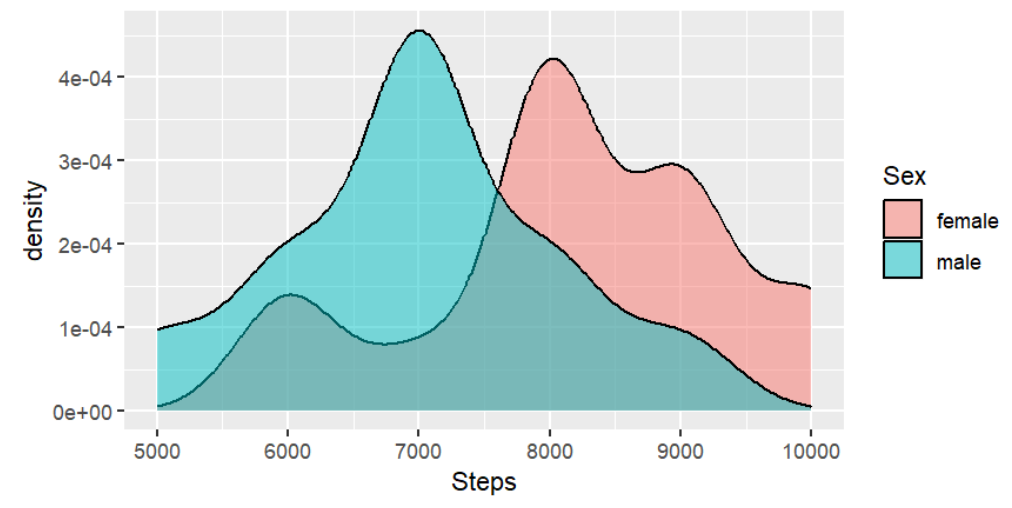
我们现在把该数据集按性别分成两组,探究步数Steps与性别Sex的关系
首先要看一看数据的分布:
ggplot(Data, aes(Steps, fill = Sex)) +  # 按sex列填充颜色并分组
       geom_density(position="dodge", alpha = 0.5);
M1 = mean(Data$Steps[Data$Sex=="female"])  # female的平均步数
M2 = mean(Data$Steps[Data$Sex=="male"])  # male的平均步数
Data$Mean[Data$Sex=="female"] = M1
Data$Mean[Data$Sex=="male"] = M2  # 添加到mean列
Data$Residual = Data$Steps - Data$Mean  # 计算残差
Data;
plot(jitter(Residual) ~ Mean, data = Data, las = 1);
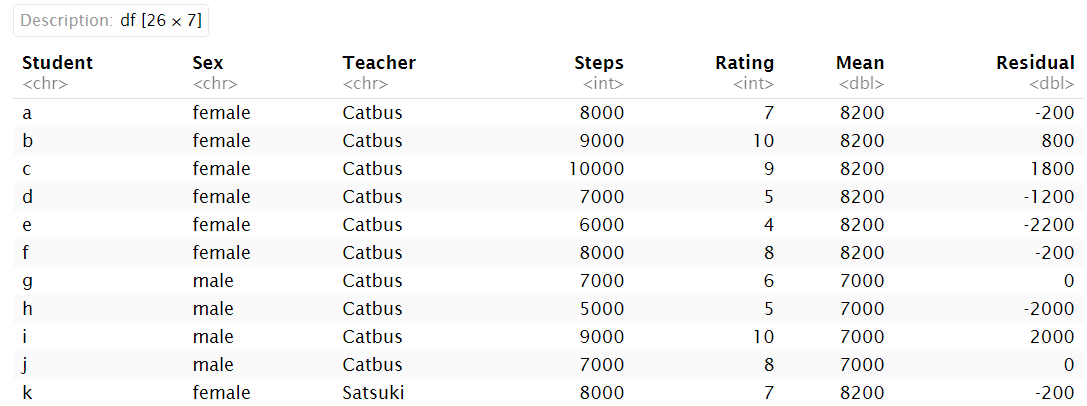

其中jitter函数对散点添加随机的“抖动”效果,将散点适当地沿x轴刻度两侧拓展,可以一定程度上避免常规散点图中点过于重叠的情况
异常值
异常值:指远远超出其他观测值的极端值
-
对于正态分布,通常是mean±3*sd或mean±2*sd范围外的值
-
对于非参数分布:
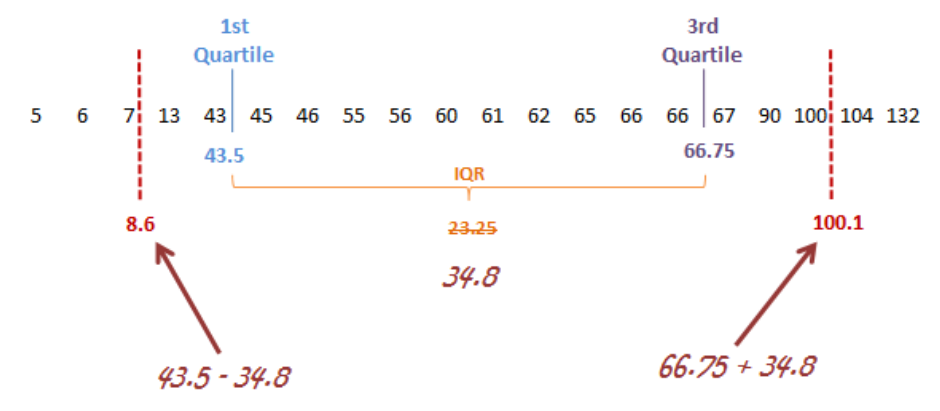
即
1/4位点-IQR至3/4位点+IQR范围外的值其中
IQR=3/4位点-1/4位点,可使用同名函数IRQ()计算
用箱型图表示异常值:
s <- summary( swiss$Infant.Mortality );
iqr <- IQR(swiss$Infant.Mortality);
ggplot( swiss, aes( y =  Infant.Mortality ) ) +
  geom_boxplot() +  # 画箱型图
  coord_flip() +  # 翻转坐标轴使箱型图横向
  geom_hline(
    yintercept = c( s["1st Qu."] - 1.5 * iqr, s["3rd Qu."] + 1.5 * iqr ),  # 添加平行于y轴的直线,作为异常值的分界线
    colour = "red", linewidth = 2, linetype = 2
  );

可以看到在左侧分界线的左面有一个异常值
t-test
使用t.test(x,y,...)函数
t.test(x, y = NULL,
       alternative = c("two.sided", "less", "greater"),
       mu = 0, paired = FALSE, var.equal = FALSE,
       conf.level = 0.95, ...)
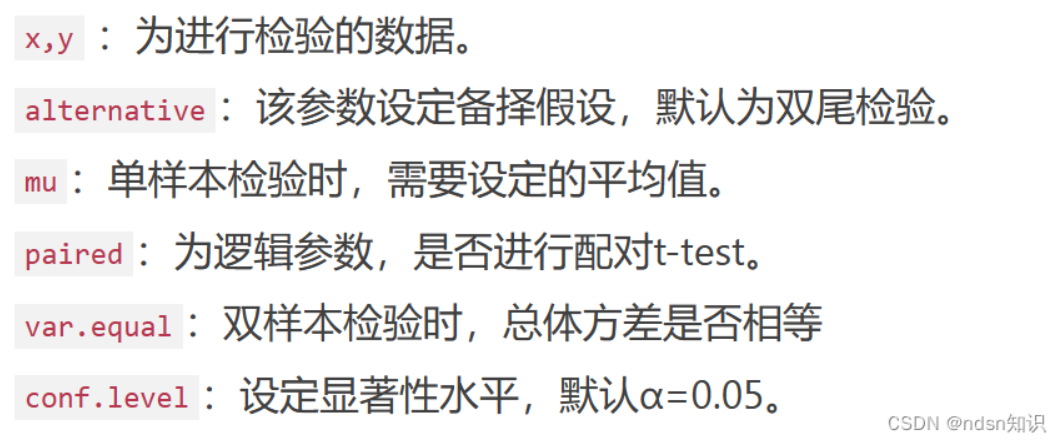
在本例中,可以进行两种t-test:one sample t-test和two samples t-test
one sample t-test:检测分布是否与预期一致。比如男生每天的步数是否显著区别于1万
with( Data, t.test( Steps[ Sex == "male" ], mu = 10000 ) );
	One Sample t-test

data:  Steps[Sex == "male"]
t = -9.083, df = 10, p-value = 3.81e-06
alternative hypothesis: true mean is not equal to 10000
95 percent confidence interval:
 6264.07 7735.93
sample estimates:
mean of x
     7000
由结果可以看出,数据的均值为7000,p值<0.05,有区别
two samples t-test:按性别分成两组,探究步数Steps与性别Sex的关系
-
with( Data, t.test( Steps ~ Sex ) ) -
with( Data, t.test( Steps[ Sex == "male" ], Steps[ Sex == "female" ] ) )
这两种方法只是写法上有区别,结果相同
	Welch Two Sample t-test

data:  Steps by Sex
t = 2.6424, df = 22.816, p-value = 0.01461
alternative hypothesis: true difference in means between group female and group male is not equal to 0
95 percent confidence interval:
  260.1421 2139.8579
sample estimates:
mean in group female   mean in group male
                8200                 7000
另一个例子:paired two sample t-test
# 准备数据
source("data/talk10/input_data2.R");
headTail(scores);
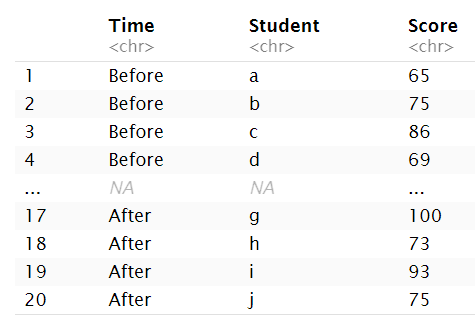
现要按time列分组,比较before和after两组的成绩score有无显著差别
很容易想到使用上面的方式:
scores$Score <- as.numeric(scores$Score);
with( scores, t.test( Score ~ Time ) );
	Welch Two Sample t-test

data:  Score by Time
t = 1.9742, df = 17.902, p-value = 0.064
alternative hypothesis: true difference in means between group After and group Before is not equal to 0
95 percent confidence interval:
 -0.6592429 21.0592429
sample estimates:
 mean in group After mean in group Before
                82.7                 72.5
观察结果可以看到p值>0.05,结果不显著
可能的原因:我们应该比较的是每个学生after和before的差别,而不是简单的分组取平均值
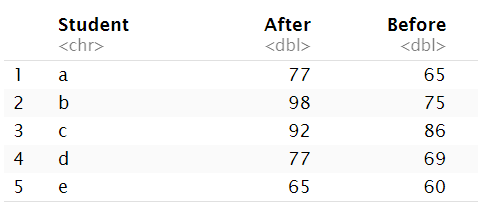
解决办法:将数据由长变宽,包含student、before、after列,列值表示每个学生after和before的成绩
scores.wide <- scores %>%
  spread( Time, Score );  # 将time列的列值变列名,新列值来自score列
head(scores.wide, n = 5);
with( scores.wide, t.test( After, Before, paired = T ) );  # 注意指定参数paired = T标明是配对检验
	Paired t-test

data:  After and Before
t = 3.8084, df = 9, p-value = 0.004163
alternative hypothesis: true mean difference is not equal to 0
95 percent confidence interval:
  4.141247 16.258753
sample estimates:
mean difference
           10.2
可以看到p值<0.05,before和after组有差别
ANOVA
方差分析(analysis of variance/ANOVA):可以检验三个或以上的样本均值是否存在显著差异,通常用于分析一个(或两个)变量对另一变量的贡献度/解释度/影响度
单因素ANOVA(One-Way ANOVA):分析一个自变量在三个或更多水平上对因变量的影响,例如班级对学生的体重是否有影响
数据准备:三个班学生的体重
wts <- bind_rows( tibble( class = 1, wt = sample( seq(50, 60, by = 0.1), 20 ) ),
                  tibble( class = 2, wt = sample( seq(55, 65, by = 0.1), 20 ) ),
                  tibble( class = 3, wt = sample( seq(60, 70, by = 0.1), 20 ) ));
ggplot(wts, aes( factor( class ), wt ) ) + geom_boxplot() + coord_flip();

model <- lm( wt ~ class, data = wts );  # 构建模型:wt与class列的关系
anova( model );  # 使用stats::anova分析模型
Analysis of Variance Table

Response: wt
          Df  Sum Sq Mean Sq F value    Pr(>F)
class      1 1139.56 1139.56  133.98 < 2.2e-16 ***
Residuals 58  493.31    8.51
---
Signif. codes:  0 ‘***’ 0.001 ‘**’ 0.01 ‘*’ 0.05 ‘.’ 0.1 ‘ ’ 1
其中我们重点关注两个值:F valueF值和Pr(>F)P值
-
F值:用来衡量组间方差和组内方差比例的统计量。一个较大的F值通常意味着至少有一组的平均值与其他组存在显著差异
注意:“较大”这个概念取决于自由度和相应的P值
-
P值:标明得到的F值是否显著。如果P值小于0.05,则认为样本间有差异(某个自变量对因变量有影响);而如果大于0.05,一般就忽略F值大小,直接认为没有影响
除此之外,Sum Sq(平方和)也可表示因素引起的变异量,该值越大则该因素的影响越大,与F值类似
在这个例子中,P值小于0.05,于是认为班级对学生的体重有影响
两因素ANOVA(Two-Way ANOVA):分析两个自变量及其交互作用对因变量的影响,例如班级和年龄对体重的影响
数据准备:三个班学生的体重和年龄
wts2 <- bind_rows(
   tibble( class = 1, age = sample( 13:15, 20, replace = T ), wt = sample( seq(50, 60, by = 0.1), 20 ) ),
   tibble( class = 2, age = sample( 14:16, 20, replace = T ), wt = sample( seq(55, 65, by = 0.1), 20 ) ),
   tibble( class = 3, age = sample( 15:17, 20, replace = T ), wt = sample( seq(60, 70, by = 0.1), 20 ) )
);
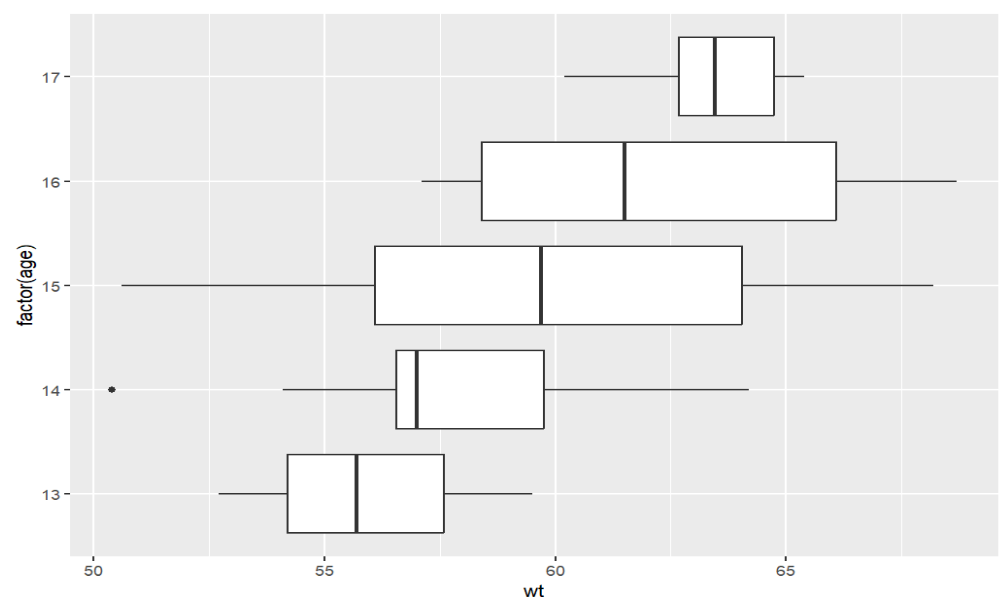
ggplot(wts2, aes( factor( age ), wt ) ) + geom_boxplot() + coord_flip();  # 不同年龄对应的体重
model3 <- lm( wt ~ class + age + class:age, data = wts2);
# 构建模型:wt与class列、age列以及class与age交互作用的关系
anova( model3 );
其中:class和age称为main effects,class:age称为interaction effects(交互作用)
Analysis of Variance Table

Response: wt
          Df Sum Sq Mean Sq F value    Pr(>F)
class      1 770.88  770.88 89.6639 3.178e-13 ***
age        1   3.47    3.47  0.4035    0.5279
class:age  1   1.50    1.50  0.1741    0.6781
Residuals 56 481.46    8.60
---
Signif. codes:  0 ‘***’ 0.001 ‘**’ 0.01 ‘*’ 0.05 ‘.’ 0.1 ‘ ’ 1
可以看到只有class的p值小于0.05,所以只有班级才对体重有影响
更详细的查看每个因素对结果的影响:使用relaimpo包中的calc.relimp函数
res5 <- relaimpo::calc.relimp( wt ~ factor(class) + age + factor(class):age, data = wts2);
res5$R2;  # 总R2,即总影响
res5$lmg;  # 每个因素的贡献
[1] 0.6282798
factor(class) factor(class):age               age
  0.527967912       0.001270408       0.099041446
非参数检验
适用于总体的分布情况未知(或者不是正态分布),同时样本容量又小的情况
非参数检验对总体分布不做假设,直接从样本的分析入手推断总体的分布
注意:当正态性假设成立时,非参数检验通常不如相应的参数检验有力。因此如果数据是正态分布,仍应使用参数检验
wilcox test
用于检验两组数据是否存在显著差异
独立样本:wilcox.test(因变量 ~ 自变量),例如两个班级的成绩是否有差异
非独立样本:wilcox.test(因变量 ~ 自变量, paired = TRUE)或wilcox.test(组1, 组2, paired = TRUE),例如同一班级中每个学生在学期初和学期末的成绩是否有差异
source("data/input_data1.R");  # 装入数据:性别与步数的关系
with( Data, wilcox.test( Steps ~ Sex ) );
	Wilcoxon rank sum test with continuity correction

data:  Steps by Sex
W = 127.5, p-value = 0.01773
alternative hypothesis: true location shift is not equal to 0
p值<0.05,拒绝零假设(步数与性别没有关系),结论为”男性步数与女性步数有差别”(步数与性别有关系)
source("data/input_data2.R");
scores.wide <- scores %>%
  spread( Time, Score );  # after和before两组成绩数据
with( scores.wide, wilcox.test( After, Before , paired=T) );
	Wilcoxon signed rank test with continuity correction

data:  After and Before
V = 53, p-value = 0.01078
alternative hypothesis: true location shift is not equal to 0
p值<0.05,after和before两组成绩数据有差异
kruskal test
也是检验两组数据的差异,但与wilcox test统计学方法不同,常用于分析三个或更多的组和独立样本的检验
source("data/input_data1.R");  # 装入数据:性别与步数的关系
with( Data, kruskal.test( Steps ~ Sex ) );
	Kruskal-Wallis rank sum test

data:  Steps by Sex
Kruskal-Wallis chi-squared = 5.7494, df = 1, p-value = 0.01649
p值<0.05,男性步数与女性步数有差别
回归
回归主要确定一个唯一的因变量(dependent variable)和一个或多个数值型的自变量(independent variable)之间的关系
之后根据这个关系对数据建立模型,来预测当自变量不同时因变量的结果
补充:因变量又称目标变量(target variable)/响应变量(response variable),自变量又称预测变量(predictor variable)
线性回归
即使用直线进行回归分析的模型
-
Y可以被一个变量X解释:一元线性回归(simple linear regression/univariate linear regression)
-
Y可以被X、Z等多个变量解释:多元线性回归(multivariate linear regression)
线性回归的假设:
-
线性:X和Y的平均值之间的关系是线性的
-
同调性:残差的方差对于X的任何值都是相同的
-
独立性:观察是相互独立的
-
正态性:对于X的任何固定值,Y都是正态分布的
注意:
-
任何检验都有基本的假设
-
将检验应用于不符合假设的数据是统计学最大的滥用
lm
我们先以一元线性回归为例
lm函数是一种构建线性回归模型的方法:lm(因变量 ~ 自变量, data=数据集)
(m <- lm(Fertility ~ Education, data = swiss));
Call:
lm(formula = Fertility ~ Education, data = swiss)

Coefficients:
(Intercept)    Education
    79.6101      -0.8624
得到的结果m就是构建的线性回归模型,之后的分析都是对它的分析
返回的数据中,Coefficients是“系数”的意思,表示对应变量在直线方程中的系数
在此例中,得到的线性方程应为y=-0.8624x+79.6101,x指Education,y指Fertility
通常我们使用summary函数对模型进行详细分析
summary(m);
Call:
lm(formula = Fertility ~ Education, data = swiss)

Residuals:
    Min      1Q  Median      3Q     Max
-17.036  -6.711  -1.011   9.526  19.689

Coefficients:
            Estimate Std. Error t value Pr(>|t|)
(Intercept)  79.6101     2.1041  37.836  < 2e-16 ***
Education    -0.8624     0.1448  -5.954 3.66e-07 ***
---
Signif. codes:  0 ‘***’ 0.001 ‘**’ 0.01 ‘*’ 0.05 ‘.’ 0.1 ‘ ’ 1

Residual standard error: 9.446 on 45 degrees of freedom
Multiple R-squared:  0.4406,	Adjusted R-squared:  0.4282
F-statistic: 35.45 on 1 and 45 DF,  p-value: 3.659e-07
其中我们重点关注Coefficients部分,依次四个值是:
Estimate  Std.Error   t value   Pr(>|t|)
  估值     标准误差      T值        P值
当p值<0.05时,就可以认为对应的估值是较准确(显著)的,可以作为回归方程中的系数
之后的Multiple R-squared“拟合优度”和Adjusted R-squared“修正的拟合优度”,标明回归方程对样本的拟合程度怎么样,这个值越高(越趋近于1)越好,可以看到这里的修正拟合优度只有0.4282,说明拟合程度并不高
最后的F-statistic“F值”和p-value“F检验的p值”,用于判断方程整体的显著性,其p值<0.05,说明方程通过显著性检验
总结:
-
T检验(
Coefficients部分)是检验解释变量的显著性的 -
R-squared是查看方程拟合程度的 -
F检验是检验方程整体显著性的
我们可以用coef函数获取模型得到的方程系数
coef( m );
coef( m )[1];
coef( m )["Education"];
(Intercept)   Education
 79.6100585  -0.8623503
(Intercept)
   79.61006
 Education
-0.8623503
除此之外,lm结果分析函数还有:
-
coefficients(m)模型系数(类似于coef) -
confint(m, level=0.95)各个系数的95%置信区间 -
residuals(m)残差 -
anova(m)方差分析 -
vcov(m)协方差 -
influence(m)回归诊断
预测
使用predict(model, data)或者fitted(model, data)根据构造的线性模型model对数据集data进行预测,data作为模型中的自变量,返回使用模型计算后的因变量
注:data应包括model中所有的自变量列,如使用
df <- data.frame(x1=c(3, 4, 4, 5, 5, 6, 7, 8, 11, 12),
                 x2=c(6, 6, 7, 7, 8, 9, 11, 13, 14, 14),
                 y=c(22, 24, 24, 25, 25, 27, 29, 31, 32, 36))
model <- lm(y ~ x1 + x2, data=df)
创建的模型,就需要使用包含x1和x2列的data预测
new <- data.frame(x1=c(5),  # 注意列名必须为x1/x2,不能是其它值
                  x2=c(10))
predict(model, newdata = new)
实际应用:
m <- lm(Fertility ~ Education, data = swiss)
predictions <- m %>% predict( swiss );
在这段代码中,我们构建了swiss$Fertility~swiss$Education的模型,又将原数据swiss$Education作为自变量传入模型中,得到预测的因变量Fertility。
可以想到,预测结果predictions与原因变量swiss$Fertility越相似,模型越准确
还可以使用coef函数得到的系数手动计算预测结果:Fertility = a * Education + intercept
a <- coef( m )["Education"];
intercept <- coef( m )[1]
predictions2 <- a * swiss$Education + intercept;
得到的结果与上面predict函数相同
如何判断是否相似:
# 构建df,有两列,分别是预测值和真实值
predict_actual <- data.frame( PREDICITON = predictions, ACTUAL = swiss$Fertility );
# 画散点图,横纵坐标分别是预测和真实值
ggplot(predict_actual, aes( PREDICITON, ACTUAL )) +
  geom_point() +
  ggtitle("SWISS DATA 1888 Fertility") +
  geom_abline(intercept = 0, slope = 1, colour = "red");  # 添加标准线y=x
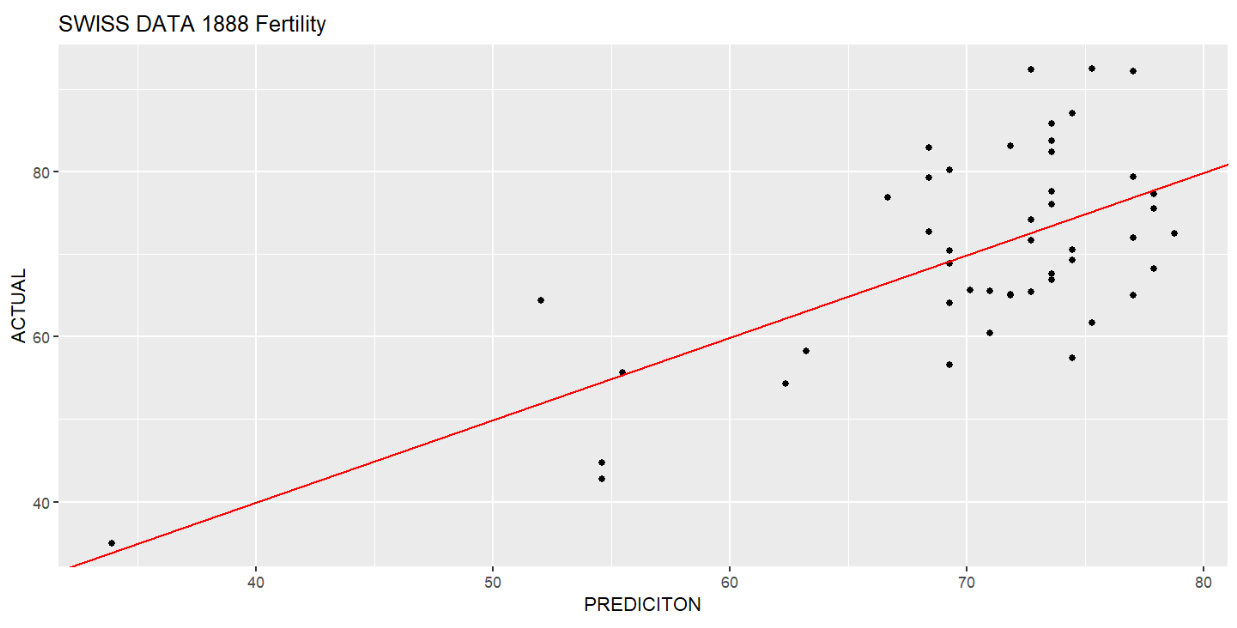
数据点(PREDICITON, ACTUAL)越靠近y=x,说明PREDICITON越相近于ACTUAL,预测越准确
上面是直观体现预测是否接近真实值的方法,也可以计算R方(拟合优度),除了summary函数中的summary(m)$r.squared,还可以:
-
cor.test函数:cortest <- cor.test(swiss$Fertility,predictions) cortest$estimate**2 # 0.4406156 -
caret包:if(!require("caret", quietly = T)) { install.packages("caret"); library("caret"); } data.frame( RMSE = RMSE(predictions, swiss$Fertility), R2 = R2(predictions, swiss$Fertility) )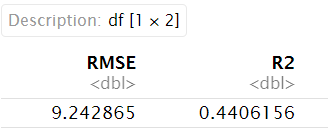
其中RMSE为均方根误差,越小模型越准确
interactions
即多元线性回归因素之间的依赖关系或互作关系,这里我们用datarium包中的marketing数据集作多元线性回归分析,展示各因素间的相互作用
if(!require("datarium", quietly = T))
{
  install.packages("datarium");
  library("datarium");
}
head(marketing);

共有4列,其中3列是广告投放的地点(youtube/facebook/newspaper),sales就是销量
我们要分析的就是不同广告投放地点对销量的影响,其中销量作因变量,三种投放地点作自变量
先做一个普通的多元线性回归
m1 <- lm( sales ~ youtube + facebook + newspaper, data = marketing );
summary(m1);
Call:
lm(formula = sales ~ youtube + facebook + newspaper, data = marketing)

Residuals:
     Min       1Q   Median       3Q      Max
-10.5932  -1.0690   0.2902   1.4272   3.3951

Coefficients:
             Estimate Std. Error t value Pr(>|t|)
(Intercept)  3.526667   0.374290   9.422   <2e-16 ***
youtube      0.045765   0.001395  32.809   <2e-16 ***
facebook     0.188530   0.008611  21.893   <2e-16 ***
newspaper   -0.001037   0.005871  -0.177     0.86
---
Signif. codes:  0 ‘***’ 0.001 ‘**’ 0.01 ‘*’ 0.05 ‘.’ 0.1 ‘ ’ 1

Residual standard error: 2.023 on 196 degrees of freedom
Multiple R-squared:  0.8972,	Adjusted R-squared:  0.8956
F-statistic: 570.3 on 3 and 196 DF,  p-value: < 2.2e-16
可以看到youtube和facebook对销量的影响是显著的
# 进行预测
predicted.m1 <- m1 %>%
  predict( marketing );
# 作真实值~预测值散点图
data.frame(p = predicted.m1, actual = marketing$sales ) %>%
  ggplot( aes(x = p, y = actual) ) +
  geom_point() +
  geom_abline(intercept = 0, slope = 1, colour = "red");
# 评估预测效果
library(caret);
data.frame(
  RMSE = RMSE(predicted.m1, marketing$sales ),
  R2 = R2(predicted.m1, marketing$sales )
);
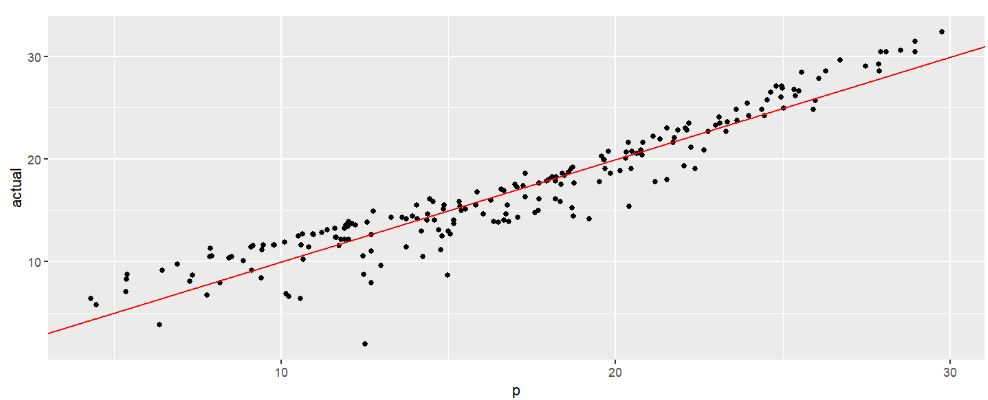

可以看出模型的预测效果还是可以的
相对重要性分析:各个自变量对因变量具体的影响程度
library(relaimpo);
calc.relimp( sales ~ youtube + facebook + newspaper, data = marketing );
重点关注结果中Relative importance metrics部分,它标明了每个因素的影响
Relative importance metrics:

                 lmg
youtube   0.58527298
facebook  0.28878652
newspaper 0.02315114
可以看到youtube的影响最大,facebook其次,而newspaper影响很小
# 有newspaper的模型
m_with_newspaper <- lm(sales ~ youtube + facebook + newspaper, data = marketing);
# 没有newspaper的模型
m_without_newspaper <- lm(sales ~ youtube + facebook, data = marketing);
# 检验两个模型间的差异
anova(m_with_newspaper, m_without_newspaper);
Analysis of Variance Table

Model 1: sales ~ youtube + facebook + newspaper
Model 2: sales ~ youtube + facebook
  Res.Df    RSS Df Sum of Sq      F Pr(>F)
1    196 801.83
2    197 801.96 -1  -0.12775 0.0312 0.8599
可以看到差异不显著(p值>0.05),因此在下面的分析中,我们可以把newspaper这个因素去掉,使用没有newspaper的模型
interactions互作关系:例如,在一平台上投放广告会促进另一个平台上广告的效果,因为两个平台的用户可能是重叠的,当在两个平台都看到广告时,更可能购买产品
方法:因变量 ~ 自变量1 + 自变量2 + 自变量1:自变量2或因变量 ~ 自变量1 * 自变量2
m4 <- lm( sales ~ youtube + facebook, data = marketing );  # 没有interactions的模型
m5 <- lm( sales ~ youtube + facebook + youtube:facebook, data = marketing );  # 等效于↓
# m5 <- lm( sales ~ youtube*facebook, data = marketing );
anova(m4, m5);  # 两个模式是否有差异?
data.frame(
  no_interactions = summary(m4)$r.squared,
  with_interactions = summary(m5)$r.squared
);  # 两个模型的预测效果
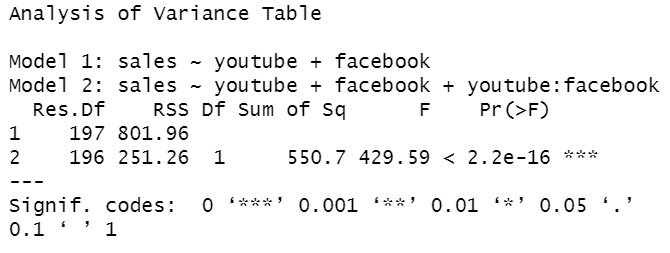

可以看到两个模型有显著差异(Pr(>F)<0.05),且加上互作分析后模型的预测效果更好
结论:在youtube和facebook两个平台同时投放广告最好
包含互作分析的相对重要性分析
library(relaimpo);
calc.relimp( sales ~ youtube*facebook, data = marketing );
Relative importance metrics:

                        lmg
youtube          0.58851843
facebook         0.30867583
youtube:facebook 0.07059629
可视化的相互作用:检验facebook对youtube的影响
使用interactions包中的sim_slopes函数
if(!require("interactions", quietly = T))
{
  install.packages("interactions");
  library("interactions");
}
m6 <- lm( sales ~ youtube*facebook, data = marketing );
sim_slopes(m6, pred = youtube, modx = facebook, jnplot = TRUE)
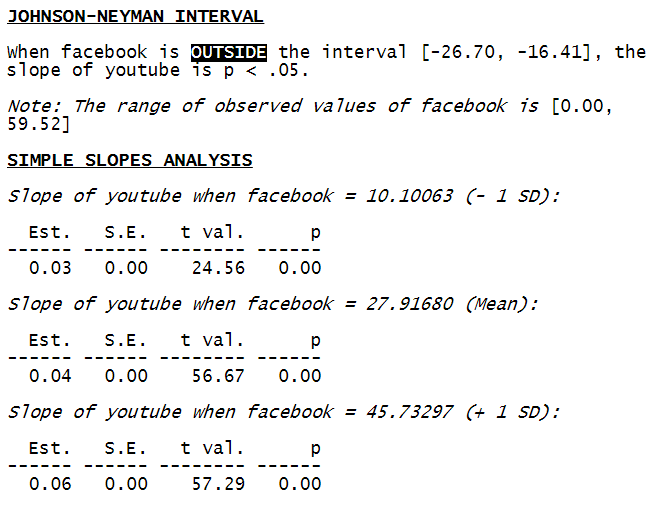
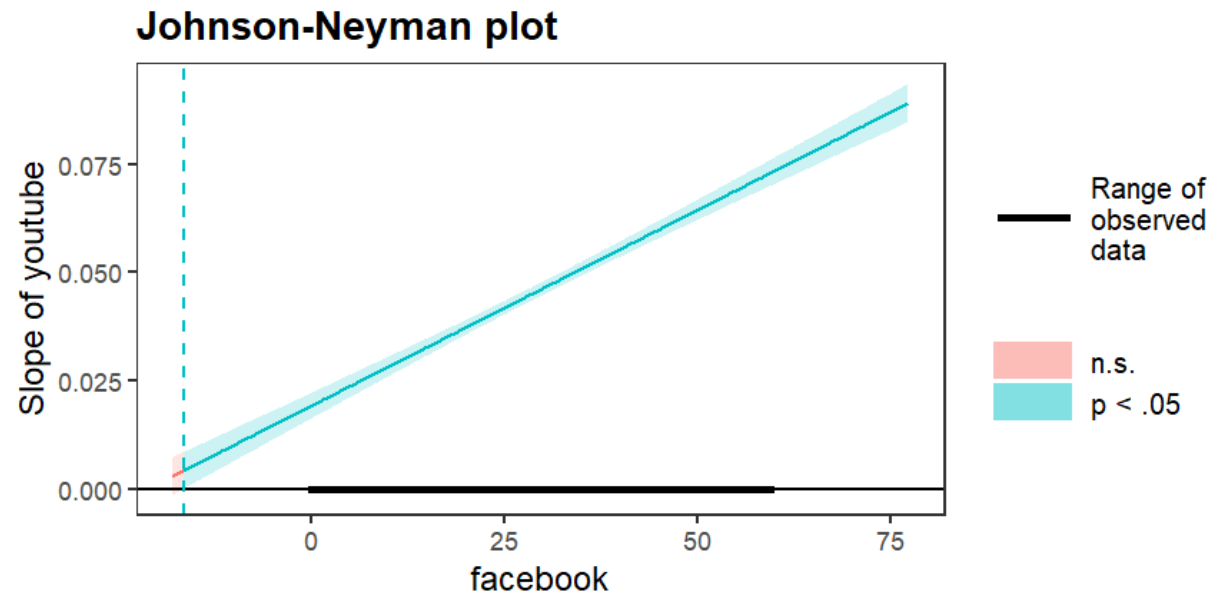
sim_slopes中m6是预测模型,pred是自变量(facebook),modx是因变量(youtube)
图中
-
蓝色部分的区域:当自变量在该区域时,对因变量的影响显著;红色则代表不显著
红色区域对应文字结果中
[-26.70, -16.41]部分When facebook is OUTSIDE the interval [-26.70, -16.41], the slope of youtube is p < .0 -
直线表示因变量~自变量模型的斜率,即直线在x轴以上(>0)时,表示自变量对因变量有正向影响;反之是负向影响
-
直线两侧的两条曲线就是置信区间,当置信区间不包括0点时,影响显著
一个其它的johnson-neyman plot可以更好的说明这一点:
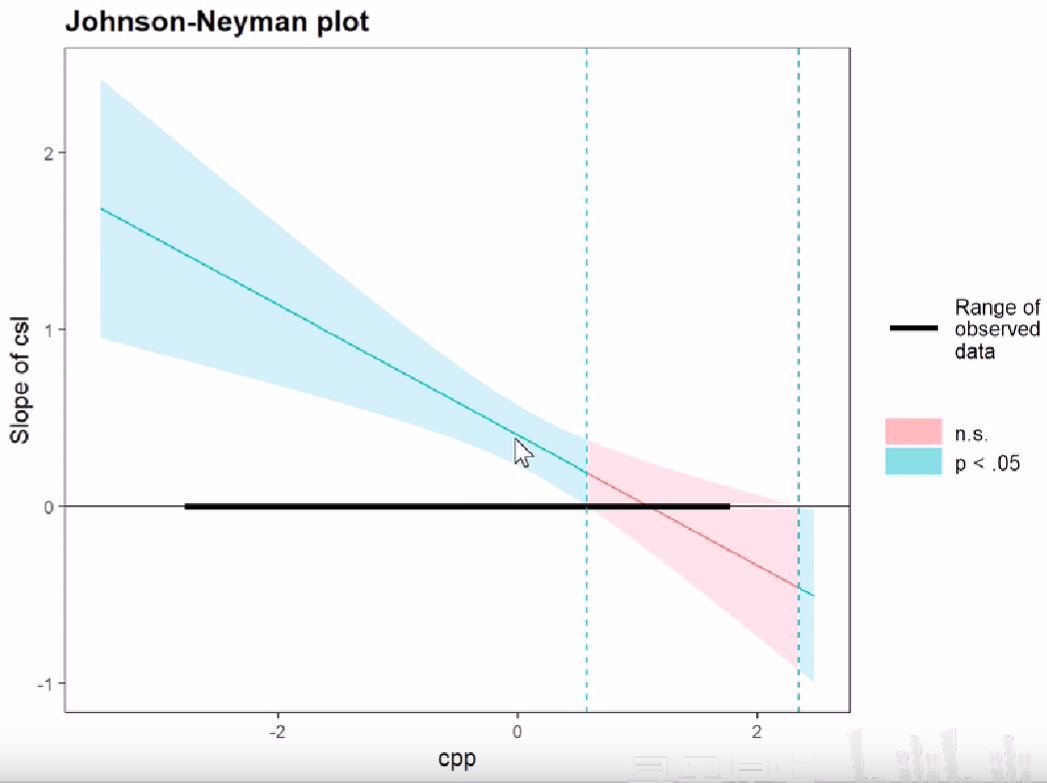
可以看到当置信区间的两条线的中间区域不跨过x轴时,是蓝色,反之是红色
-
x轴上画粗的部分就是自变量实际的取值范围
对应文字结果中
[0.00, 59.52]部分Note: The range of observed values of facebook is [0.00, 59.52]
glm
即广义线性模型
用法类似于lm,不同的是它可以使用family参数指定数据的分布,并分析非正态分布的数据
当family=gaussian即数据正态分布(高斯分布)时,它与lm()完全相同
m.lm <- lm(am ~ disp + hp, data=mtcars);
m.glm <- glm(am ~ disp + hp, data=mtcars);
coef(m.lm);
coef(m.glm);
 (Intercept)         disp           hp
 0.755928587 -0.004289191  0.004362551
 (Intercept)         disp           hp
 0.755928587 -0.004289191  0.004362551
使用glm拟合二项分布模型
二项分布模型:因变量Y只有两个值,比如1/0
# 选出iris中Species列为"setosa"和"virginica"的行
dat <- iris %>%
  dplyr::filter( Species %in% c("setosa", "virginica") );
dat$newSpecies <- ifelse(  # 将字符串列值转成数值型
  dat$Species == "setosa", 0, 1
);  # "setosa"->0  "virginica"->1
head(dat %>% sample_n(6) %>% dplyr::select(Species, newSpecies));  # 随机选出6行展示
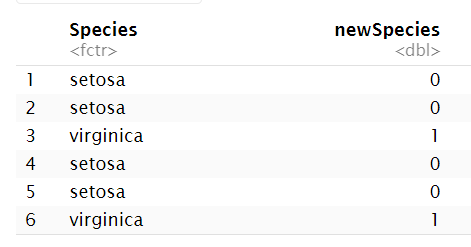
# 构建模型:Sepal.Length对Species即newSpecies的影响
bm <- glm(
  newSpecies ~ Sepal.Length,
  data = dat,  # 数据集
  family = binomial  # 二项分布
);
bm;
summary(bm);
Call:  glm(formula = newSpecies ~ Sepal.Length, family = binomial, data = dat)

Coefficients:
 (Intercept)  Sepal.Length
     -38.547         6.805

Degrees of Freedom: 99 Total (i.e. Null);  98 Residual
Null Deviance:	    138.6
Residual Deviance: 26.25 	AIC: 30.25

Call:
glm(formula = newSpecies ~ Sepal.Length, family = binomial, data = dat)

Coefficients:
             Estimate Std. Error z value Pr(>|z|)
(Intercept)   -38.547      9.557  -4.033 5.50e-05 ***
Sepal.Length    6.805      1.694   4.016 5.91e-05 ***
---
Signif. codes:  0 ‘***’ 0.001 ‘**’ 0.01 ‘*’ 0.05 ‘.’ 0.1 ‘ ’ 1

(Dispersion parameter for binomial family taken to be 1)
重点关注两个值:
-
bm中的AIC:赤池信息准则(Akaike Information Criterion),值越小拟合效果越好 -
summary(bm)中的Pr(>|z|):<0.05则说明Sepal.Length对Species影响显著
可以看到Sepal.Length增大使newSpecies增大,越趋近于”virginica”
# 使用模型进行预测
data.frame(
  predicted = bm %>% predict( dat ),
  original = dat$Species
) %>%
  sample_n(10);
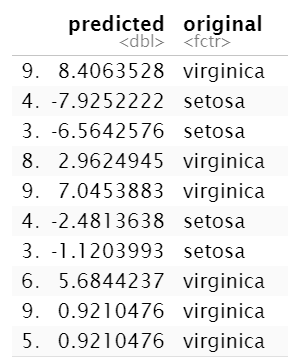
可以看到,predict越小,则代表Species越可能是”setosa”
使用type="response"进行预测
在predict函数中设置type="response"参数,得到的是预测概率,即预测结果为1的概率
data.frame(
  predicted_response = bm %>% predict( dat, type = "response" ),
  original = dat$Species
) %>%
  sample_n(5);
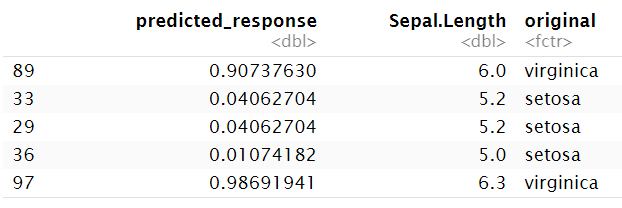
这5行分别表示:
-
根据
Sepal.Length=6.0预测newSpecies有0.907的概率为1(即有很大概率Species为”virginica”) -
根据
Sepal.Length=5.2预测newSpecies有0.041的概率为1(即有很大概率Species为”setosa”) -
根据
Sepal.Length=5.2预测newSpecies有0.041的概率为1(即有很大概率Species为”setosa”) -
根据
Sepal.Length=5.0预测newSpecies有0.011的概率为1(即有很大概率Species为”setosa”) -
根据
Sepal.Length=6.3预测newSpecies有0.987的概率为1(即有很大概率Species为”virginica”)
除此之外,glm还可用于泊松分布的预测,设置family=poisson
原理相同,这里不作介绍
非线性回归
非线性回归(Non-linear regression/nls):使用由一个或多个自变量组成的非线性函数来预测目标变量
nls(因变量~包括自变量的公式, start=list(参数1=初始值, ...))
例:
# 准备数据
x <- c(1:50);  # 1,2,...,50
a <- runif(1, 10, 20);  # 生成一个10-20间的数
b <- runif(1, 0, 10);  # 生成一个0-10间的数
y <- (a*x)/(b+x);  # y=a*x/(b+x)
y_new <- y+rnorm(50,0,1);  # 为数据添加随机的抖动
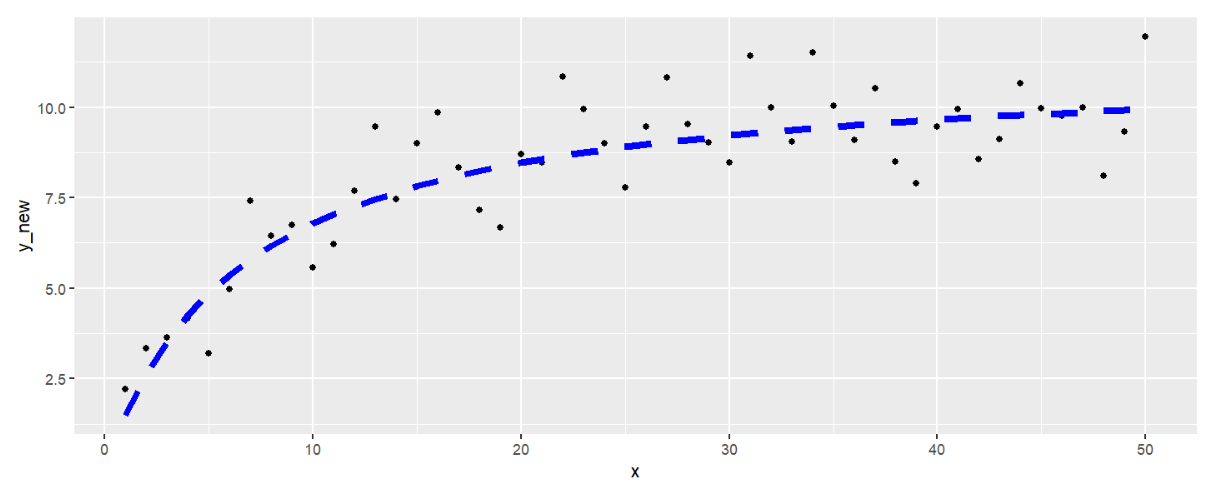
ggplot() +  # 展示数据
  geom_point(aes(x=x, y=y_new)) +  # 散点图
  geom_line(aes(x=x, y=y),lty=2,col="blue",lwd=2);  # y~x关系
# 进行预测
m <- nls(
  y_new ~ pre_a*x/(pre_b+x),  # 指定y与x间的关系为y=a*x/(b+x)
  start = list(pre_a=0.1, pre_b=0.1)  # 指定a与b的起始值(从这个值开始尝试拟合)
);  #
print(paste0('true a:', a));
print(paste0('true b:', b));
summary(m);
[1] "true a:11.2422794732265"
[1] "true b:6.57833542907611"

Formula: y_new ~ pre_a * x/(pre_b + x)

Parameters:
      Estimate Std. Error t value Pr(>|t|)
pre_a   11.284      0.444  25.415  < 2e-16 ***
pre_b    6.113      1.072   5.701 7.15e-07 ***
---
Signif. codes:  0 ‘***’ 0.001 ‘**’ 0.01 ‘*’ 0.05 ‘.’ 0.1 ‘ ’ 1

Residual standard error: 1.097 on 48 degrees of freedom

Number of iterations to convergence: 9
Achieved convergence tolerance: 2.399e-06
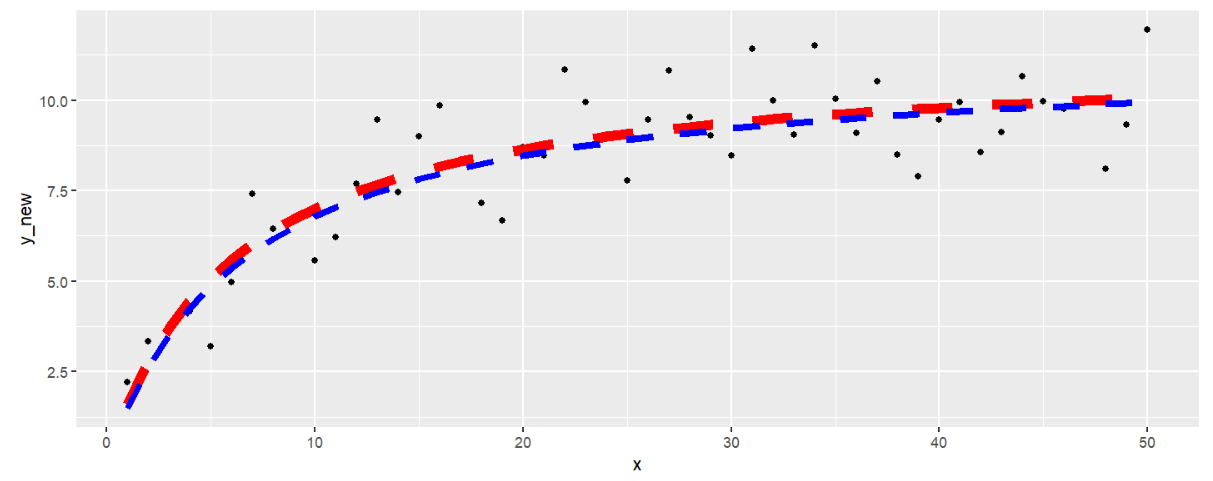
可以看到两个参数的p值都<0.05,且与实际值很接近
# 看看预测出来的曲线
ggplot() +
  geom_point(aes(x=x, y=y_new)) +
  geom_line(aes(x=x, y=predict(m, x)),lty=2,col="red",lwd=3) +  # 预测曲线
  geom_line(aes(x=x, y=y),lty=2,col="blue",lwd=2);  # 实际曲线
也可使用drc包:
if(!require("drc", quietly = T))
{
  install.packages("drc");
  install.packages('carData');
  library("drc");
}
它的拟合函数可以提供公式模板,不需指定包含自变量的公式,以及各参数初始值
# 使用上例的数据生成方法
x <- seq(0,50,1);
y_old <- (runif(1,10,20)*x)/(runif(1,0,10)+x);
y <- y_old+rnorm(51,0,1);
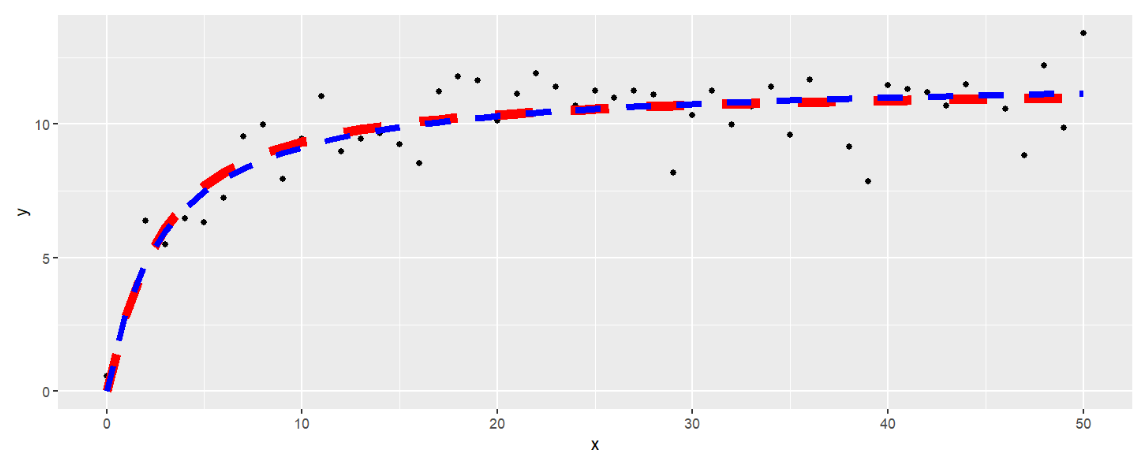
m_drc <- drm( y ~ x, fct = LL.3() );  # 使用LL.3()模型
ggplot() +
  geom_point(aes(x=x,y=y)) +
  geom_line(aes(x=x, y=predict(m_drc)), col="red", linetype=2, ,lwd=3) +
  geom_line(aes(x=x, y=y_old),lty=2,col="blue",lwd=2);
drm包配合aomisc包使用,后者提供了更多的模板,用于拟合更多的函数
if(!require("aomisc", quietly = T))
{
  if(!require("devtools", quietly = T))
  {
    install.packages("devtools");
    library("devtools");
  }
  devtools::install_github("onofriAndreaPG/aomisc");
  library("aomisc");
}
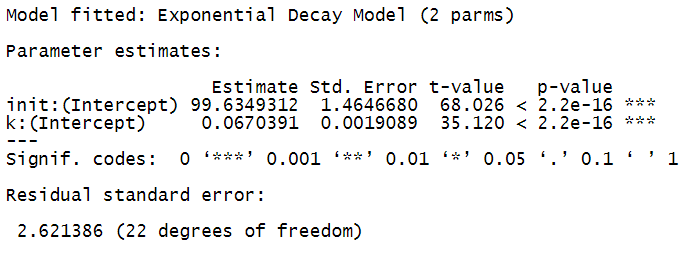
例1:Exponential decay指数衰减函数y = a * (exp(k * X) * k)
data(degradation);  # 载入数据degradation
m14 <- drm(
  Conc ~ Time,
  data = degradation,
  fct = DRC.expoDecay()  # 指定模型
);
summary(m14);
plot(m14, log="");

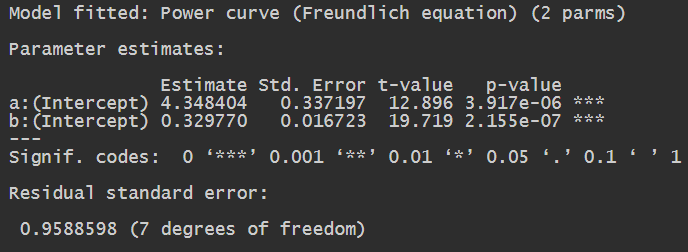
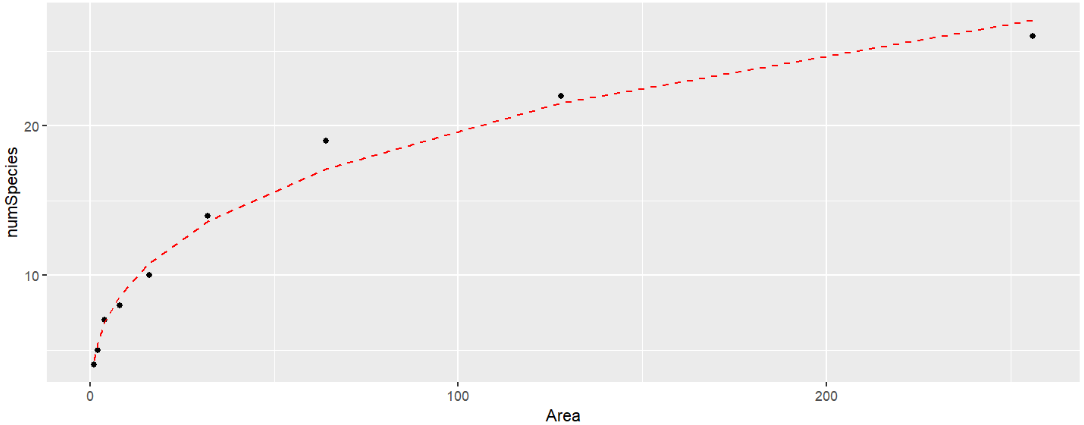
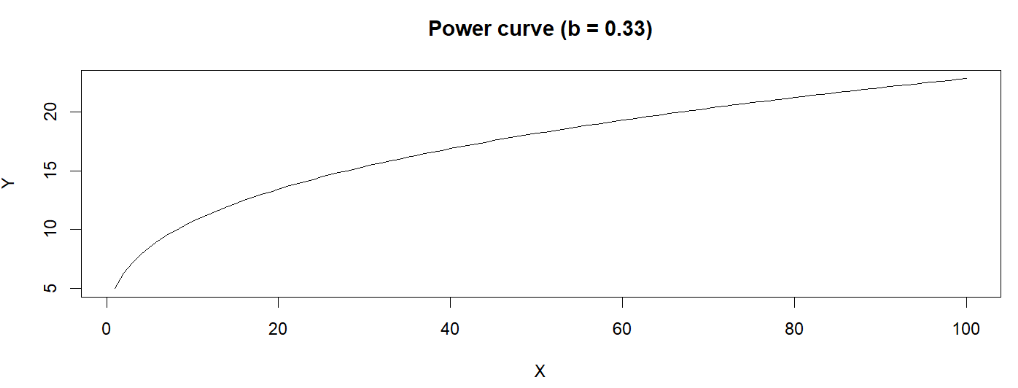
例2:Power curve功率曲线a * (X^(b - 1) * b)
data(speciesArea);  # speciesArea
m15 <- drm(
  numSpecies ~ Area,
  data = speciesArea,
  fct = DRC.powerCurve()
);
summary(m15);
ggplot( speciesArea, aes(x= Area, y= numSpecies) ) +
  geom_point( aes(x= Area, y= numSpecies) ) +
  geom_line(
    aes(x = Area, y = predict( m15, speciesArea )),
    colour = "red", linetype = 2
  );
与线性回归模型进行比较:
library(caret);
# 非线性回归模型
R2(  speciesArea$numSpecies, predict( m15, speciesArea ) );
# 线性回归模型
m16 <- lm( numSpecies ~ Area, data = speciesArea );
R2(  speciesArea$numSpecies, predict( m16, speciesArea ) );
[1] 0.9874392
[1] 0.8110041
可以看到非线性回归模型的R方更大,准确性更高
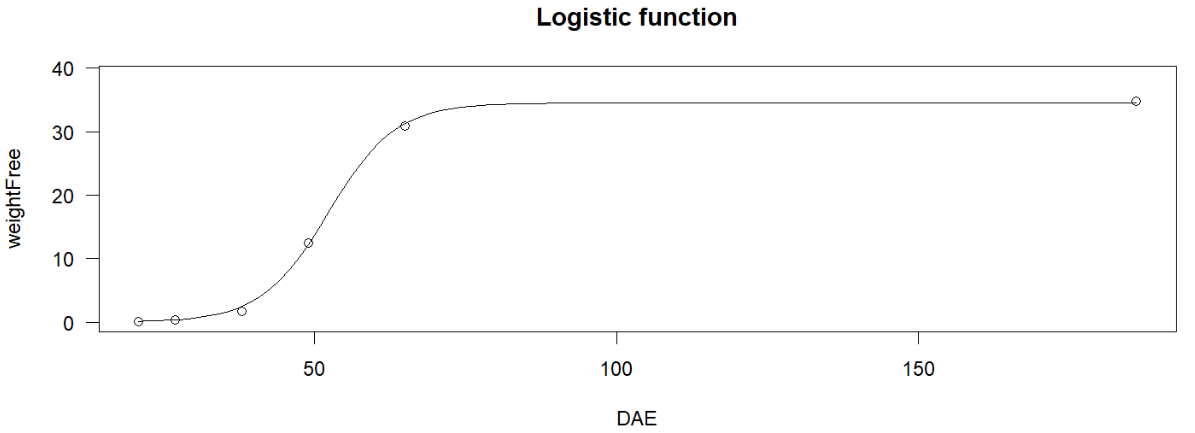
例3:logistic函数(logistic function)/S型曲线(sigmoid曲线)
data(beetGrowth);
m17 <- drm(
  weightFree ~ DAE,
  data = beetGrowth,
  fct = L.3()
);
plot(m17, log="", main = "Logistic function");
除此之外,drm包和aomisc包还可用于数据生成
如powerCurve.fun(x, a, b)可生成y = a * (X^(b - 1) * b)
plot(
  powerCurve.fun(1:100, 5, 0.33),
  xlab = "X", ylab = "Y",
  main = "Power curve (b = 0.33)",
  type = "l"  # 将数据点隐藏
);
多元非线性回归简介
主要有两个方向:
-
MARS(Multivariate Adaptive Regression Splines)多元自适应回归样条
-
machine learning机器学习
这里以MARS为例
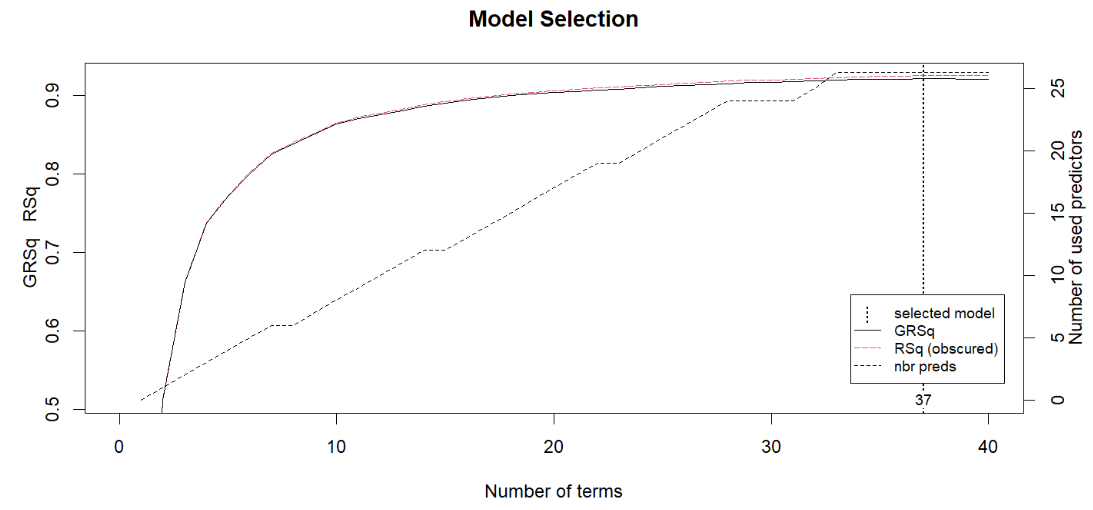
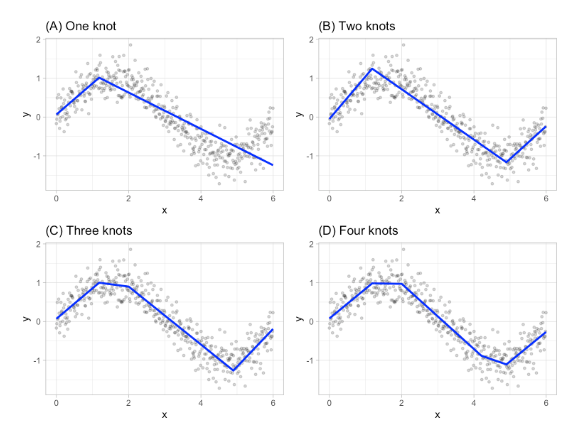
MARS提供了一种通过评估切割点(cutpoints)/节点(knots)来捕捉数据中非线性关系的便捷方法。该程序将每个预测器的每个数据点评估为一个节点,并使用候选特征创建线性回归模型
一个例子:
# 准备数据
library(AmesHousing);  # The Ames Iowa Housing Data
ames <- AmesHousing::make_ames();
head(ames);

# 进行拟合
library(earth);
mars1 <- earth( Sale_Price ~ .,  data = ames );
print(mars1);
plot(mars1, which = 1);

