R的简单教程--04ggplot2进阶与实战
r-rbase华中科技大学–组学数据分析与可视化课程–大二上课程笔记第四部分,包括更多画子图的方式、为图增加公式及统计信息、堆叠与并列柱状图、画图函数的计算方法、图的主题以及实战案例等
写在前面:本篇内容及例子(除标注了参考文章/具体案例的部分,以及一些比较零碎的小知识点)均来自华中科技大学–组学数据分析与可视化课程–大二上 / 笔记中使用的数据 / 关于本课程的复习资料 / 课程作业答案 / 课程作业答案–中文注释版
ggplot2进阶
更多画子图的方式
cowplot包
if (!require("cowplot")){
  install.packages("cowplot");
  library("cowplot");
}
cowplot::plot_grid(
    子图对象1, 子图对象2, ... ,
    labels=c(图1名称, 图2名称, ...),
    ncol = 总列数,
    nrow = 总行数,
    byrow = TRUE,  # 第二个子图默认向右画
    ...
)
注意:byrow决定的是子图对象的位置,不决定labels的位置,labels都是向右延伸(第二个labels都在第一个labels的右面)
sp <- ggplot(mpg, aes(x = cty, y = hwy, colour = factor(cyl)))+
  geom_point(size=2.5);
bp <- ggplot(diamonds, aes(clarity, fill = cut)) +
  geom_bar() +
  theme(axis.text.x = element_text(angle=70, vjust=0.5));
cowplot::plot_grid(sp, bp, sp, labels=c("sp", "bp", "sp"), ncol = 2, nrow = 2);
cowplot::plot_grid(sp, bp, sp, labels = c("sp", "bp", "sp"), ncol = 2, nrow = 2, byrow = F);
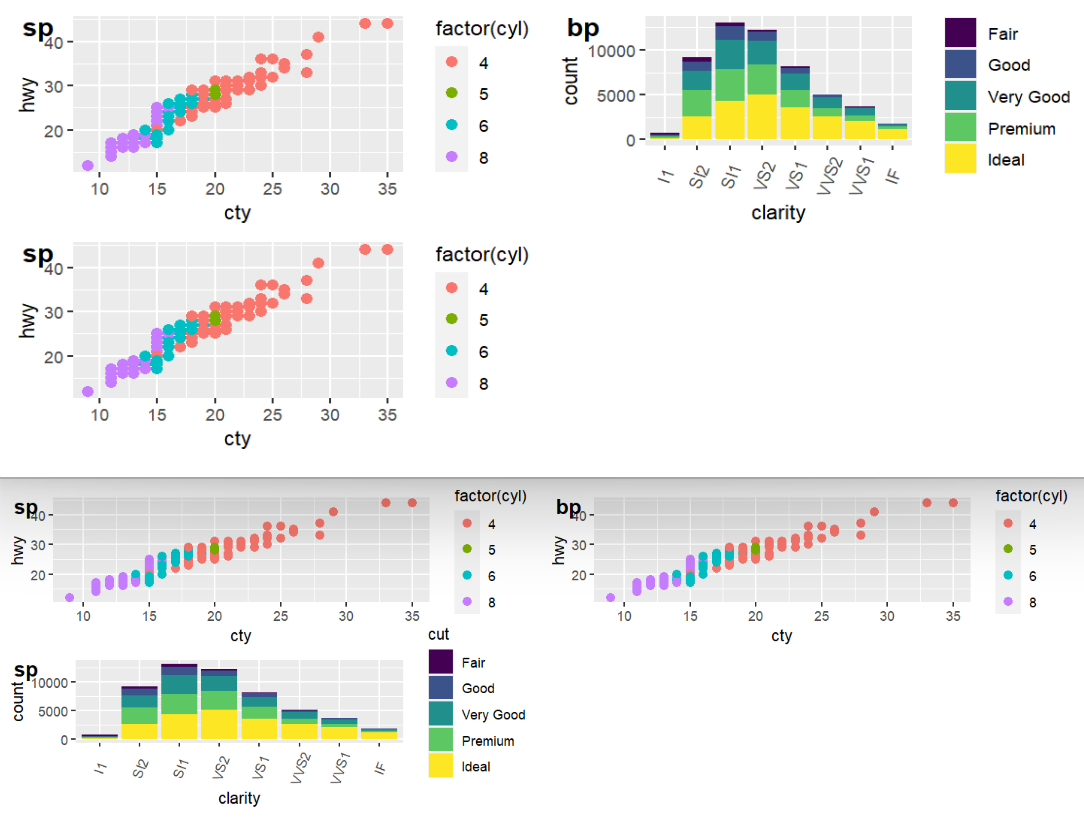
可以看到图的顺序发生了改变,而左上角标签的位置不变
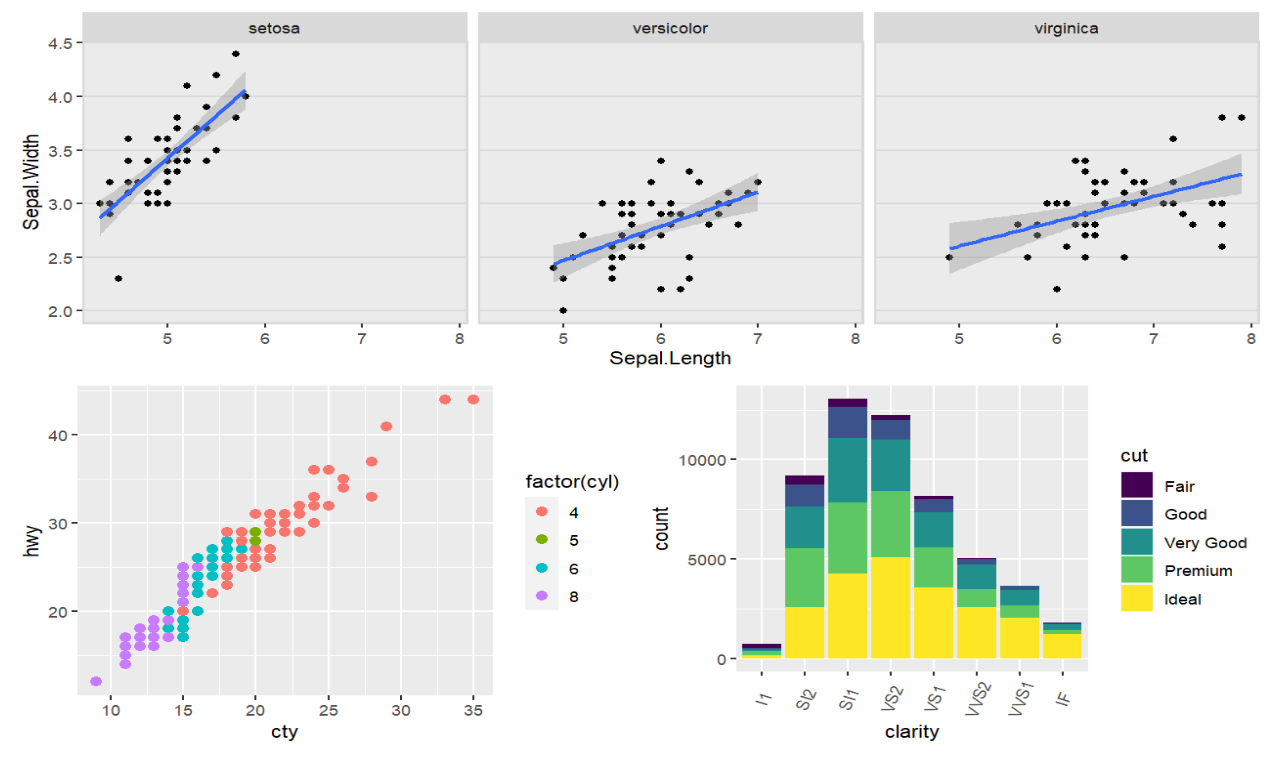
指定每个图的大小和位置:draw_plot(plot, x = 0, y = 0, width = 1, height = 1)其中xy以及宽高取值均为0-1间,表示占整个图的百分比,坐标以左下角为原点
# 使用上面画的sp bp
plot.iris <- ggplot(iris, aes(Sepal.Length, Sepal.Width)) +
  geom_point() +
  facet_grid(. ~ Species) +
  stat_smooth(method = "lm") +
  background_grid(major = 'y', minor = "none") + # add thin horizontal lines
  panel_border();
(plot <-
  ggdraw() +  # 相当于创建一个大的画板
  draw_plot(plot.iris, x=0, y=.5, width=1, height=.5) +
  draw_plot(sp, 0, 0, .5, .5) +
  draw_plot(bp, .5, 0, .5, .5));  # 分别画在大画板的哪个位置,以及高度宽度分别是多少
为每个子图设置标签:draw_plot_label(c(标签名), c(标签x轴位置), c(标签y轴位置))
还可以设置字体颜色color、字体尺寸size等
plot +
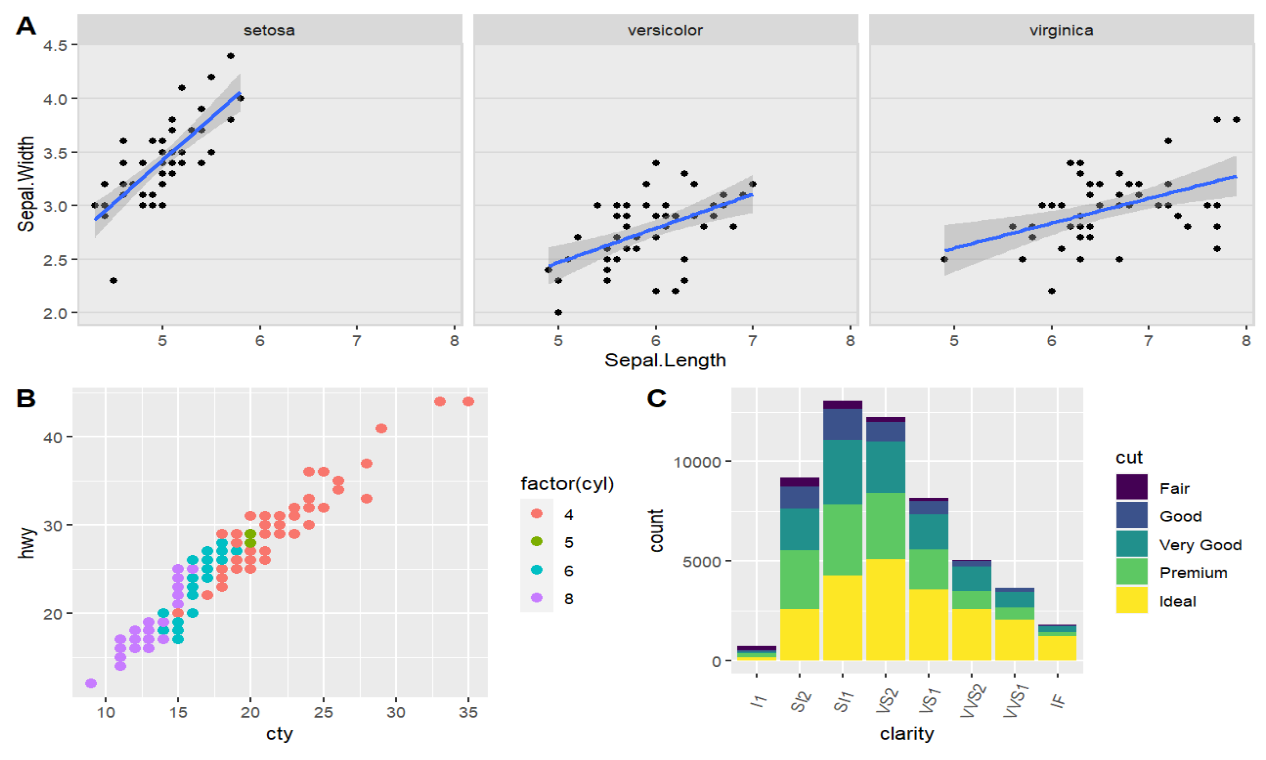
  draw_plot_label(c("A", "B", "C"), c(0, 0, 0.5), c(1, 0.5, 0.5), size = 15);
表示”A”在x=0 y=1的位置,”B”在x=0 y=0.5的位置,”C”在x=0.5 y=0.5的位置
gridExtra包
if (!require("gridExtra")){
  install.packages("gridExtra");
  library("gridExtra");
}
先创建子图对象:
df <- ToothGrowth
df$dose <- as.factor(df$dose)
bp <- ggplot(df, aes(x=dose, y=len, color=dose)) +
  geom_boxplot() +
  theme(legend.position = "none") +
  labs( tag = "A");
dp <- ggplot(df, aes(x=dose, y=len, fill=dose)) +
  geom_dotplot(binaxis='y', stackdir='center')+
  stat_summary(fun.data=mean_sdl, mult=1, geom="pointrange", color="red")+
  theme(legend.position = "none") +
  labs( tag = "B");
vp <- ggplot(df, aes(x=factor(dose), y=len)) +
  geom_violin()+
  geom_boxplot(width=0.1) +
  labs( tag = "C");
sc <- ggplot(df, aes(x=dose, y=len, color=dose, shape=dose)) +
  geom_jitter(position=position_jitter(0.2))+
  theme(legend.position = "none") +
  theme_gray() +
  labs( tag = "D");
grid.arrange(子图对象1, 子图对象2, ... , ncol, nrow)指定行列数:
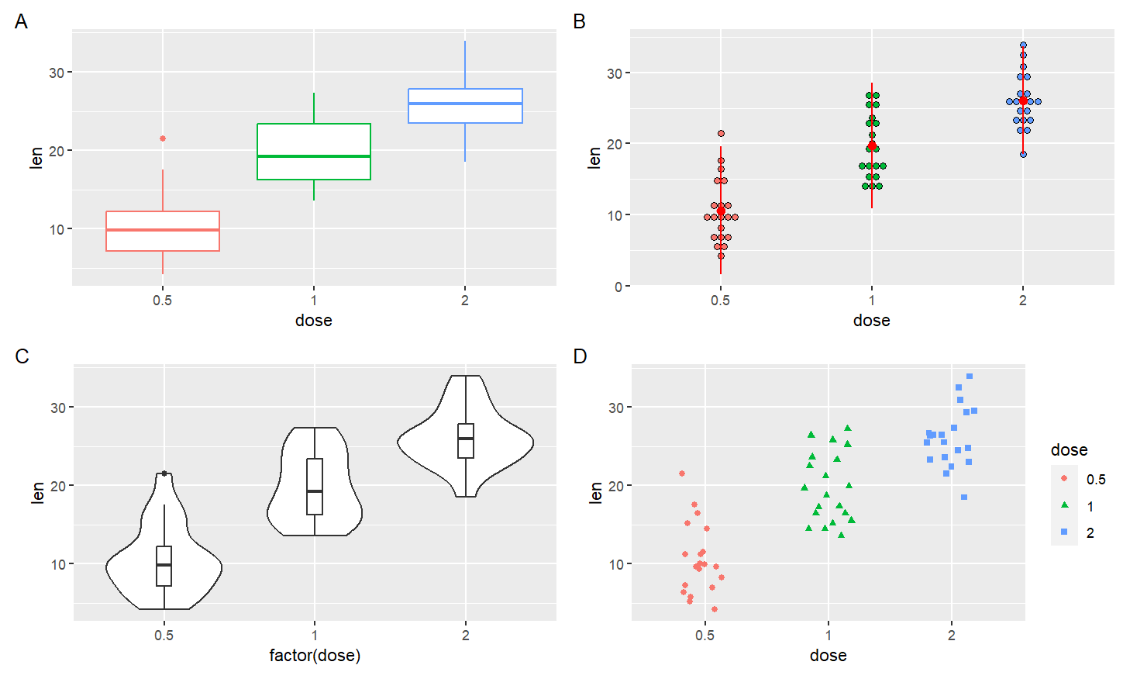
grid.arrange(bp, dp, vp, sc, ncol=2, nrow =2);
使用layout_matrix参数:由一个矩阵确定绘图区域的每个格子都画哪些图:
grid.arrange(bp, dp, vp, sc, ncol = 2,
             layout_matrix = cbind(c(1,1,1), c(2,3,4)));
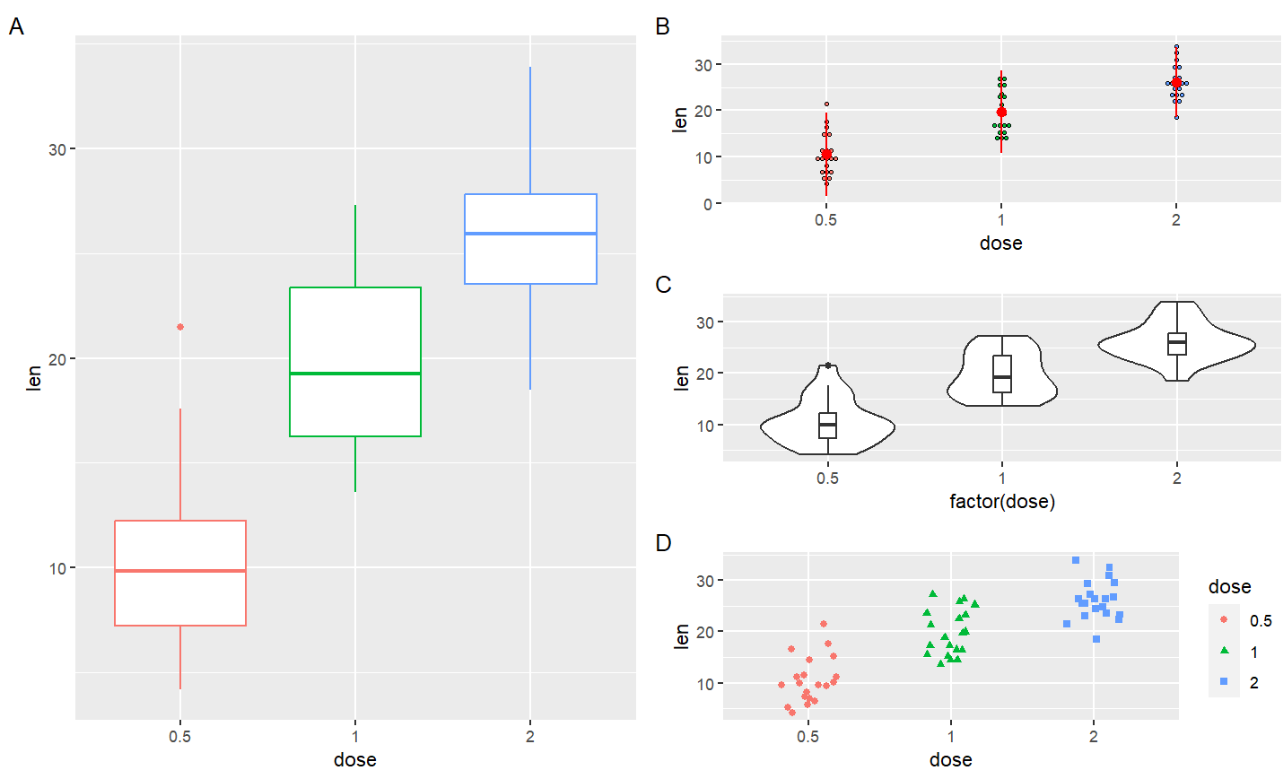
-
c(1,1,1)是第一列画哪些图,全是1就全画第一张图 -
c(2,3,4)是第二列画第2 3 4张图
cbind(c(1,1,1), c(2,3,4))矩阵的样子:
     [,1] [,2]
[1,]    1    2
[2,]    1    3
[3,]    1    4
可以这样理解:将整个画板按n行m列的矩阵分成n行m列的格子,画板的每个格子与矩阵每个位置的值相对应——矩阵中为1的位置都画第一张图,为2的位置画第二张图,…
另一个例子:
grid.arrange(bp, dp, vp, sc, ncol = 3,
             layout_matrix = cbind(c(1,1), c(2,2), c(3,4)));
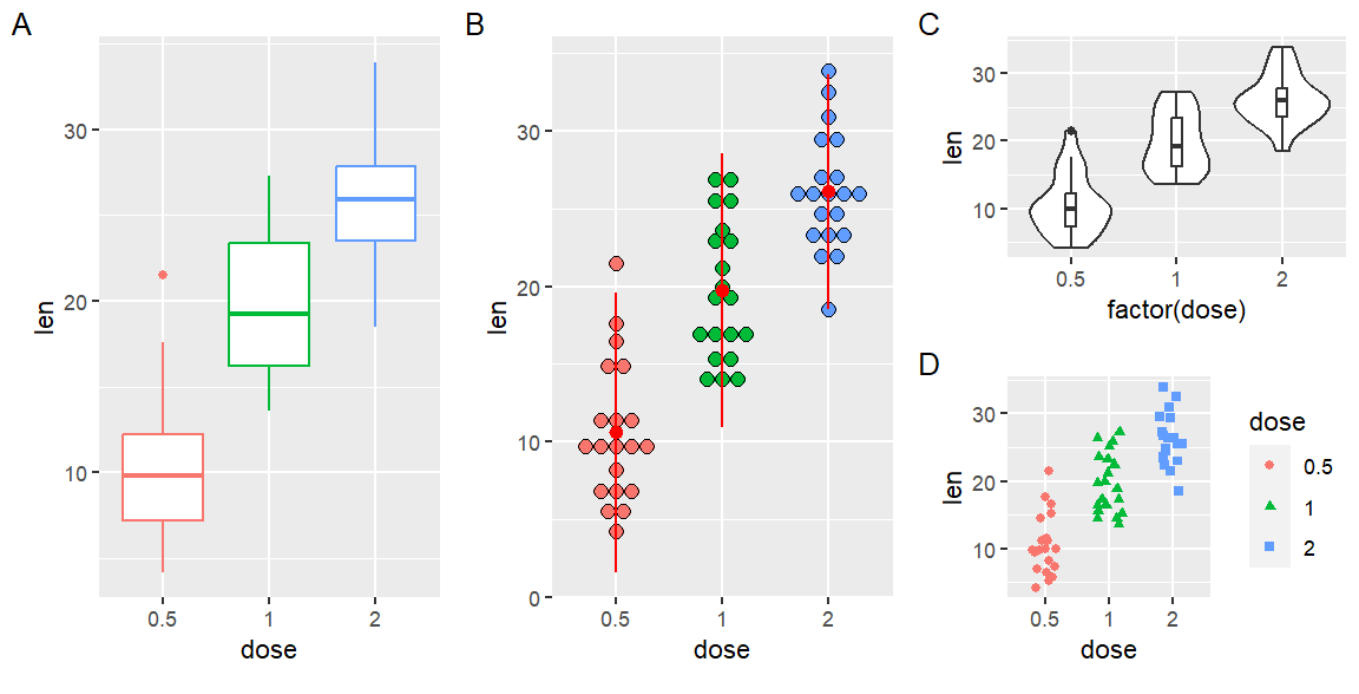
gridExtra包与图例:
实现效果:让两张图共享一个图例,图例显示在两张图的正上方
思路:把图例画成一张图,使用grid.arrange让第一行是图例,第二行是两张图
get_legend <- function(myggplot){
  tmp <- ggplot_gtable(ggplot_build(myggplot))
  leg <- which(sapply(tmp$grobs, function(x) x$name) == "guide-box")
  legend <- tmp$grobs[[leg]]
  return(legend)
}
该函数接收一个图,返回这个图中的图例
# 第一张子图(有图例)
bp <- ggplot(df, aes(x=dose, y=len, color=dose)) +
  geom_boxplot() +
  labs(tag = "A") +
  theme(legend.position = "top");  # 让图例在图的上方
# 第二张子图(无图例)
vp <- ggplot(df, aes(x=dose, y=len, color=dose)) +
  geom_violin()+
  geom_boxplot(width=0.1) +
  labs( tag = "B") +
  theme(legend.position="none");  # 去掉图例
# 将第一张子图的图例提取出来
legend <- get_legend(bp);
# 再删去第一张子图的图例
bp2 <- bp + theme(legend.position="none");
绘图:
grid.arrange(legend, bp2, vp,  ncol=2, nrow = 2,
             layout_matrix = rbind(c(1,1), c(2,3)),
             widths = c(2.7, 2.7), heights = c(0.2, 2.5));
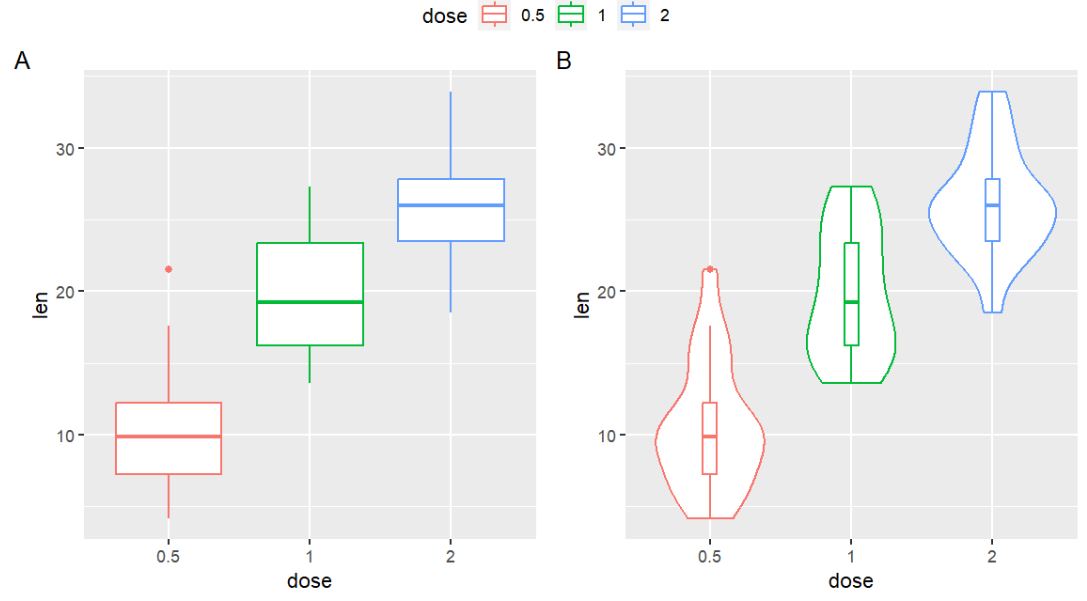
其中widths和heights指定了第一行和第二行的宽高,第一行因为是图例,所以高度较小
rbind(c(1,1), c(2,3))矩阵的样子:
     [,1] [,2]
[1,]    1    1
[2,]    2    3
即第一行的两个格子全是第一张图的,第二行分别是第2/3张图
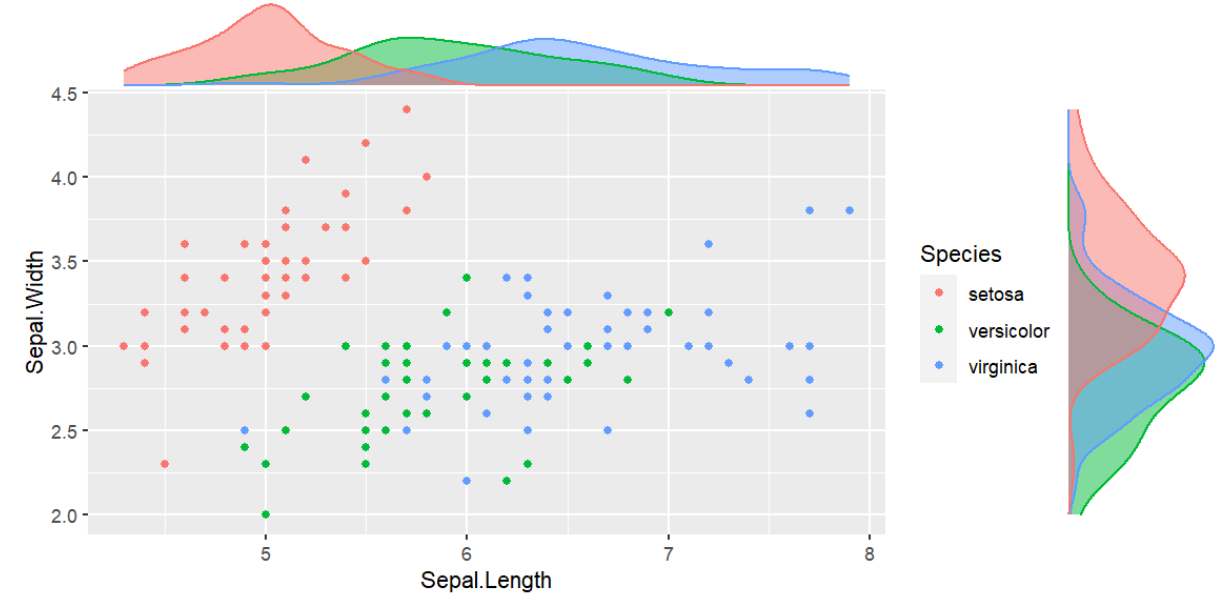
ggExtra包
用于向已有图中添加边缘直方图(marginal histograms),展示数据的分布状况
if (!require("ggExtra")){
  install.packages("ggExtra");
  library("ggExtra");
}
一个基本图:
(piris <- ggplot(iris, aes(Sepal.Length, Sepal.Width, colour = Species)) +
  geom_point());
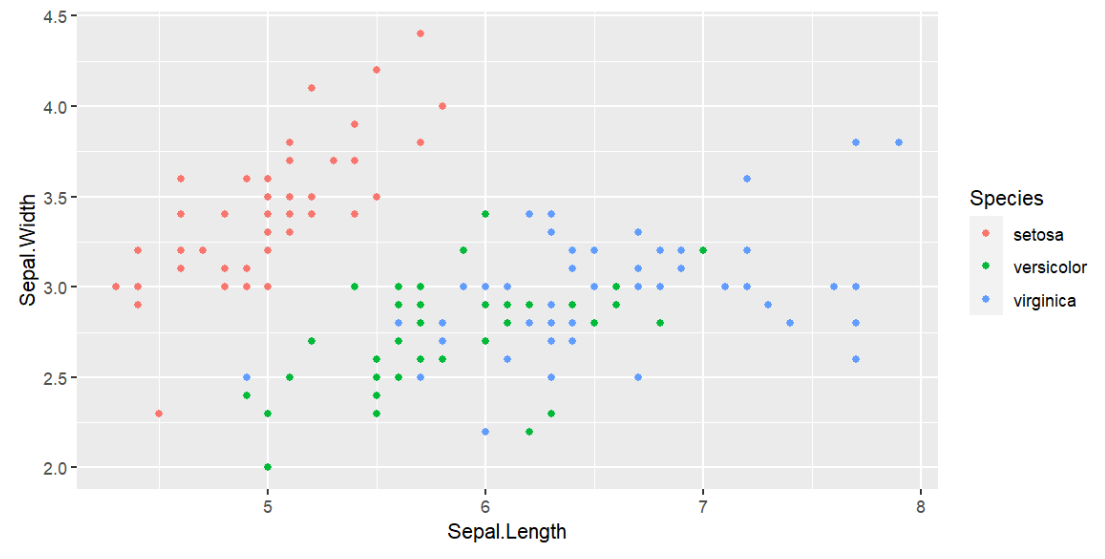
添加边缘直方图:
ggMarginal(piris, groupColour = TRUE, groupFill = TRUE);
在图中写公式或统计信息
如何写公式
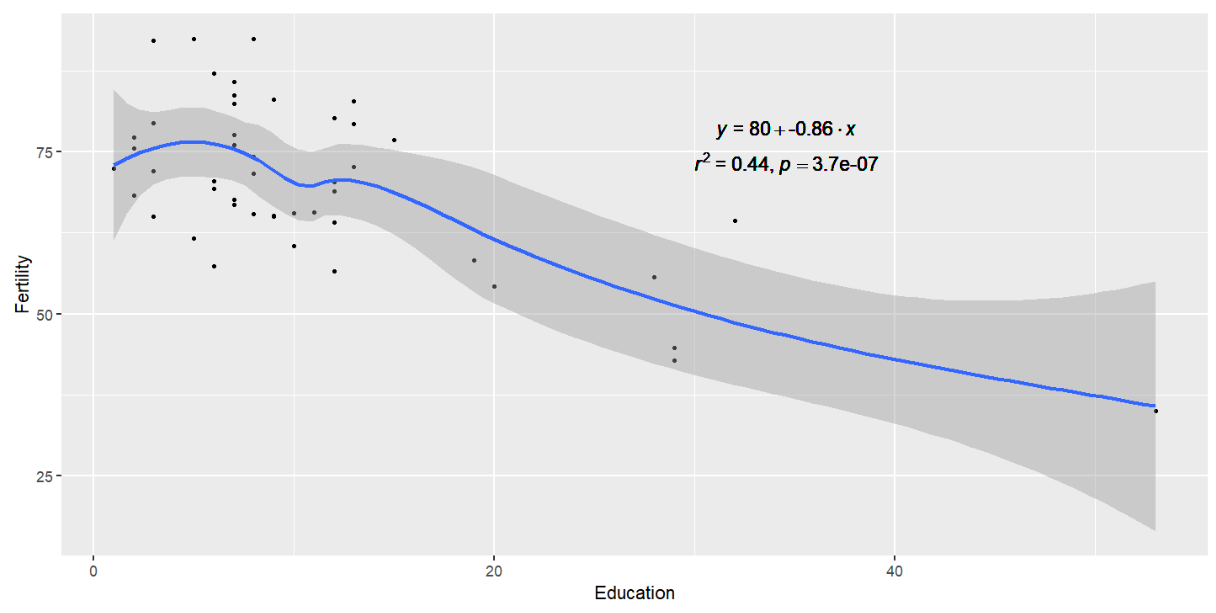
先看一个例子:
m = lm(Fertility ~ Education, swiss);  # 回归拟合分析
c = cor.test( swiss$Fertility, swiss$Education );  # 相关性分析
eq <- substitute(  # 写公式
  atop(
    paste( italic(y), " = ",  a + b %.% italic(x), sep = ""),
    paste( italic(r)^2, " = ", r2, ", ", italic(p)==pvalue, sep = "" )
  ),
  list(
    a = as.vector( format(coef(m)[1], digits = 2) ),
    b =  as.vector( format(coef(m)[2], digits = 2) ),
    r2 =  as.vector( format(summary(m)$r.squared, digits = 2) ),
    pvalue =  as.vector( format( c$p.value , digits = 2) )
  )
);
eq <- as.character(as.expression(eq));  # 先把eq转成公式,再变成字符串,以便写入图中
ggplot(swiss, aes( x = Education,  y = Fertility ) ) +  # 画图
  geom_point( shape = 20 ) +  # 散点图
  geom_smooth( se = T ) +  # 拟合曲线
  geom_text( data = NULL,  # 写文字
             aes( x = 30, y = 80, label= eq, hjust = 0, vjust = 1),  # 文字的内容和位置
             size = 4, parse = TRUE, inherit.aes=FALSE);
-
atop(<equation_1> , <equation_2>)将两个公式上下放置,返回一个<equation>。其中italic函数将普通字符转为斜体加粗的公式变量形式 -
substitute(<equation>, list(变量名=值,...))将公式中的变量名替换为数值,如上例中就是替换了abr2pvalue -
geom_text-
data是否需要继承前面的画图数据swiss -
aes(x, y, label)标签的x/y位置及内容label -
size文字大小 -
family字体 -
nudge_x/nudge_y设置文字距原坐标点的距离 -
check_overlap=T设置不画与同一层中的上一个文本重叠的文本 -
parse=T将字符串表示成公式形式 -
inherit.aes=F不继承之前的aes设置
-
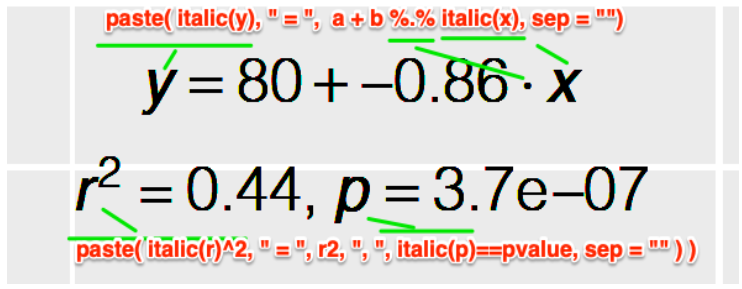
公式的写法1:
paste( italic(y), " = ",  a + b %.% italic(x), sep = "")
paste( italic(r)^2, " = ", r2, ", ", italic(p)==pvalue, sep = "" )
公式的写法2(不使用paste函数拼接):
italic(y) == a + b %.% italic(x)
italic(r)^2~"="~r2*","~italic(p)==pvalue
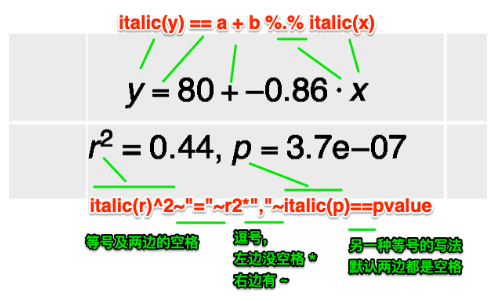
在这种方法中,引号两边必须有*或~字符,~表示空格,*表示什么都没有,~~表示两个空格
公式中的代数负号:
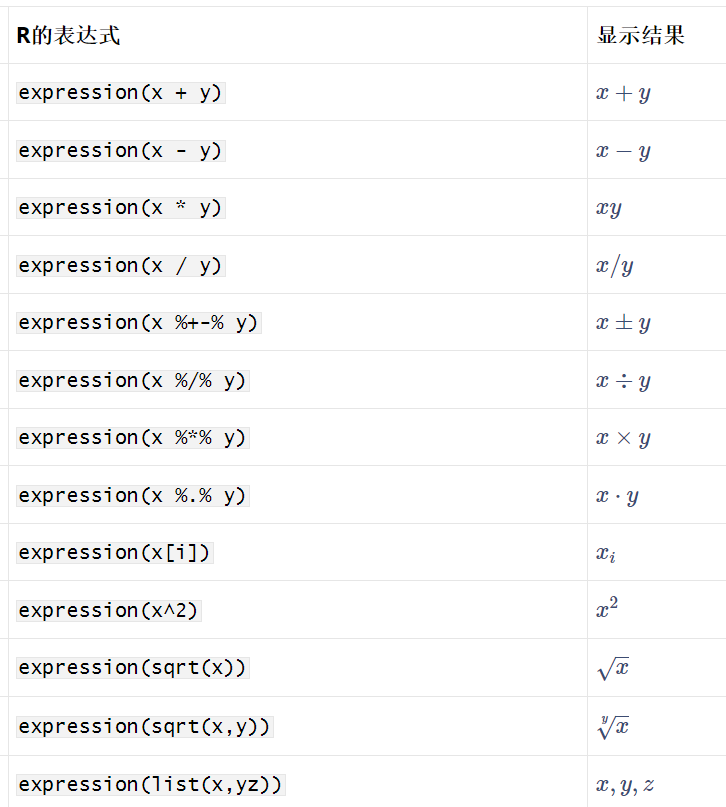
调整公式位置–hjust/vjust/angle
-
hjust/vjust调整水平/垂直方向的位置-
hjust取值通常为0-1,0是左对齐(默认)、0.5是居中、1是右对齐 -
vjust取正值就是垂直向下移动,负值是向上移动
-
-
angle使文本绕中心点旋转一定角度,取值为整数(正–逆时针、负–顺时针),单位为°
这三个参数可被用于各种需要写文字的地方,如坐标轴标签、文本注释等等
例1:
df = data.frame(team=c('The Amazing Amazon Anteaters',
                       'The Rowdy Racing Raccoons',
                       'The Crazy Camping Cobras'),
                points=c(14, 22, 11));
ggplot(data=df, aes(x=team, y=points)) +
  geom_bar(stat='identity') +
  theme(axis.text.x = element_text(angle=90)) ;
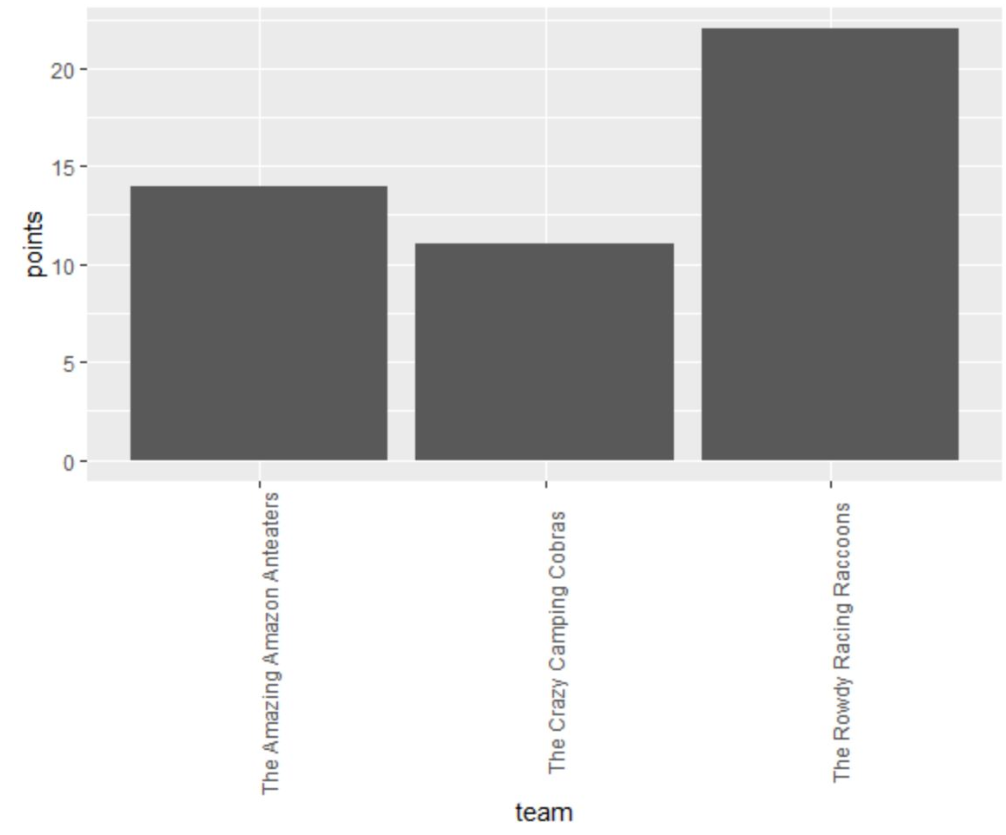
这里使用了angle=90让x轴标签变为竖向,避免堆叠
可以使用hjust和vjust参数来调整x轴标签,使其与x轴上的刻度线更紧密地排列:
ggplot(data=df, aes(x=team, y=points)) +
  geom_bar(stat='identity') +
  theme(axis.text.x = element_text(angle=90, vjust=.5, hjust=1));
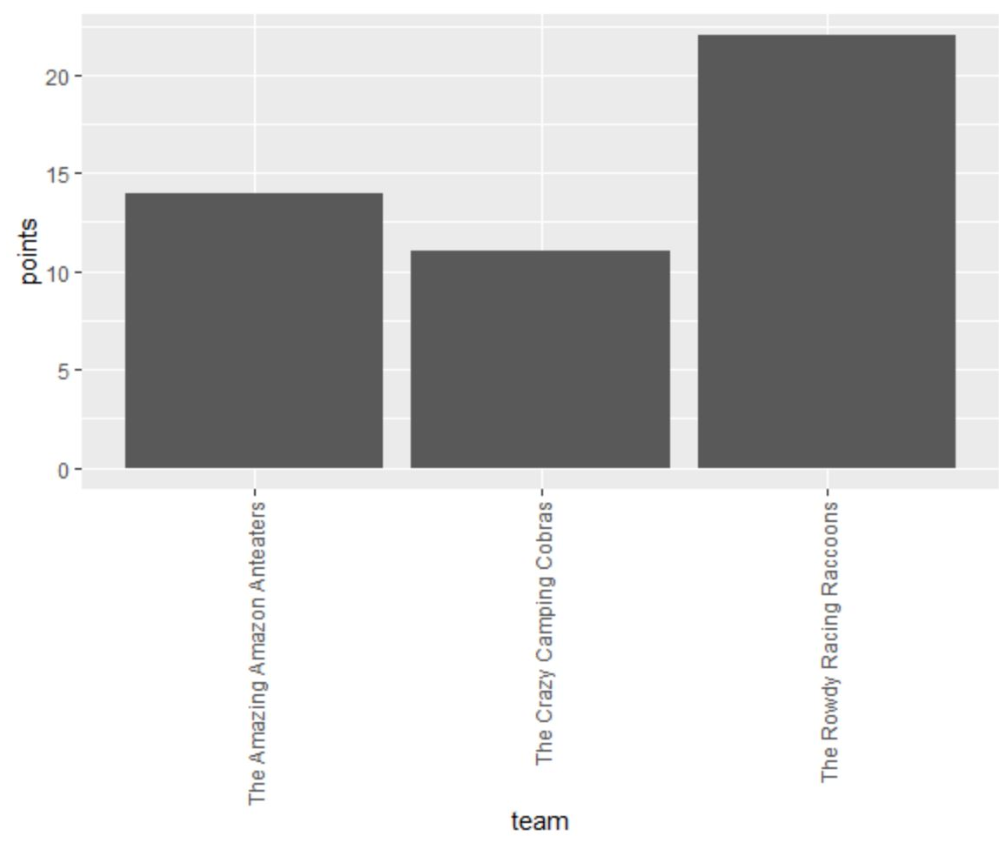
可以看到x轴标签向左/上移动了一些
例2:
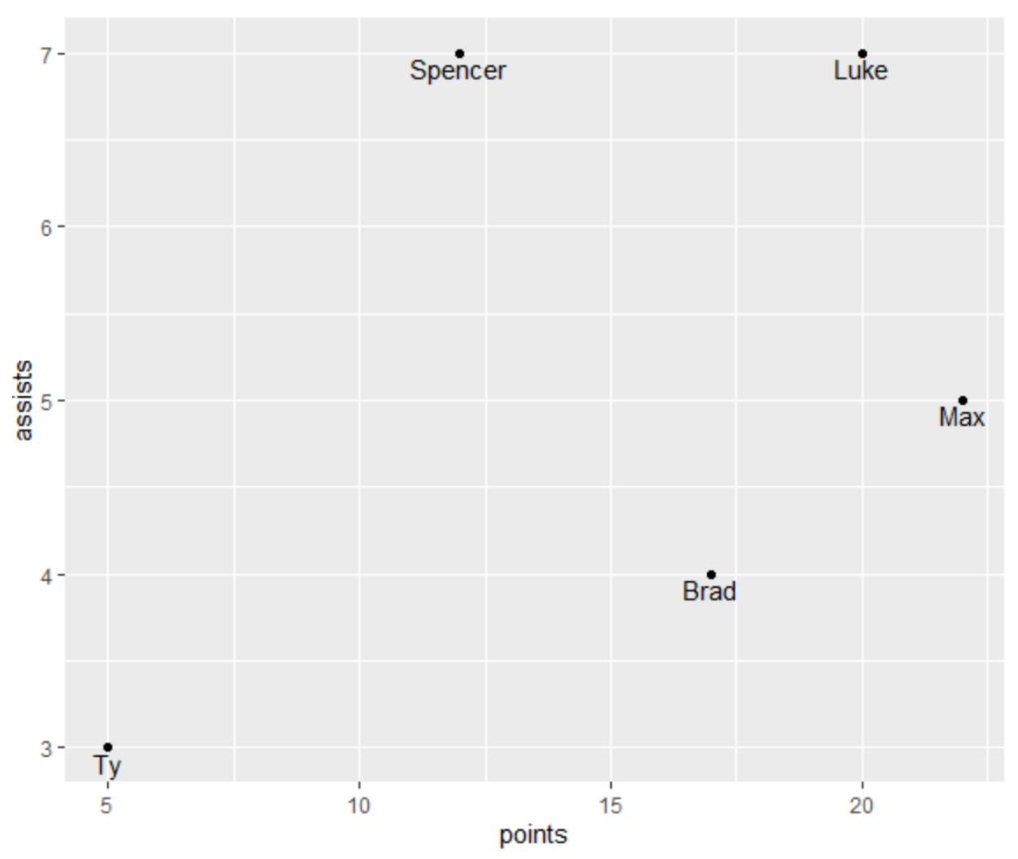
df <- data.frame(player=c('Brad', 'Ty', 'Spencer', 'Luke', 'Max'),
                 points=c(17, 5, 12, 20, 22),
                 assists=c(4, 3, 7, 7, 5));
ggplot(df) +
  geom_point(aes(x=points, y=assists)) +
  geom_text(aes(x=points, y=assists, label=player));
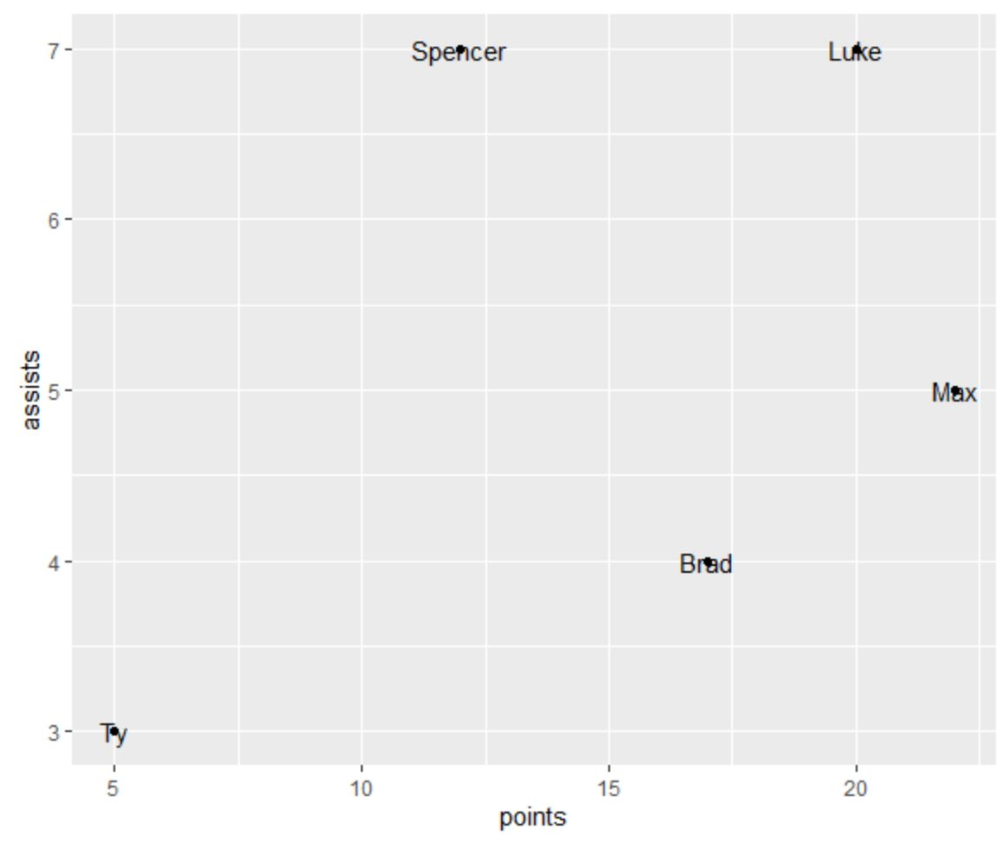
将文字向下移动使更容易阅读:
ggplot(df) +
  geom_point(aes(x=points, y=assists)) +
  geom_text(aes(x=points, y=assists, label=player), vjust=1.2);
希腊字符
使用geom_text(aes(label="alpha"), parse=T)
希腊字符的英文写法:
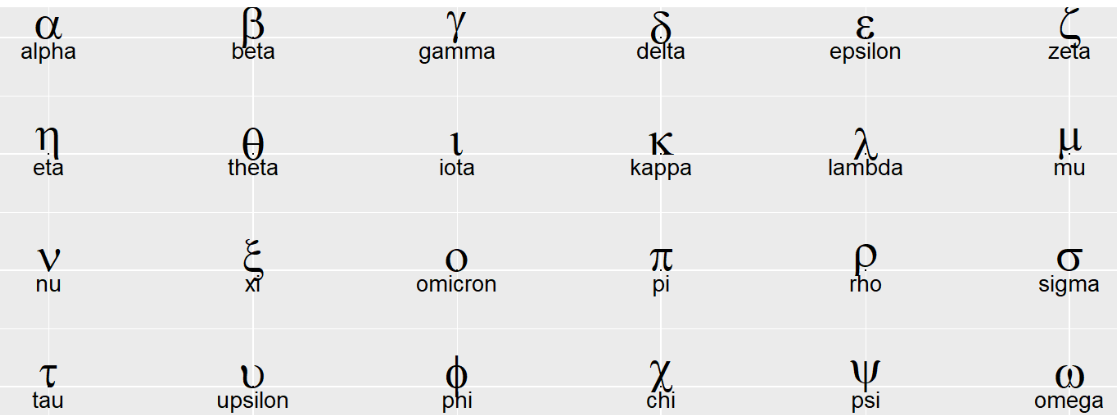
如何画出这个图?
思路:先画出4x6个点,再对点添加文本
准备数据:
greeks <- c("Alpha", "Beta", "Gamma", "Delta", "Epsilon", "Zeta",
            "Eta", "Theta", "Iota", "Kappa", "Lambda", "Mu",
            "Nu", "Xi", "Omicron", "Pi", "Rho", "Sigma",
            "Tau", "Upsilon", "Phi", "Chi", "Psi", "Omega");
dat <- data.frame( x = rep( 1:6, 4 ), y = rep( 4:1, each = 6), greek = greeks );  # rep是将数组复制多少次
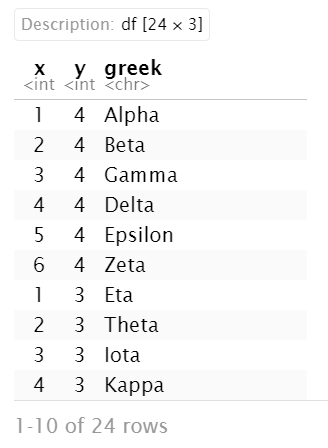
即每个文本对应的xy坐标
绘图:
plot2 <-
  ggplot( dat, aes(x=x,y=y) ) +
  geom_point(size = 0) +
  geom_text( aes( x, y + 0.1, label = tolower( greek ) ), size = 10, parse = T ) +
  geom_text( aes( x, y - 0.1, label = tolower( greek ) ), size = 5 );
注意两个geom_text的label都相同,但一个是写希腊符号,另一个是写普通英文,区别是parse = T参数,它控制是否要对字符串进行公式化转换
更多公式写法
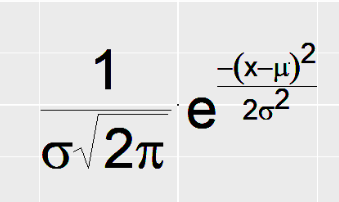
例1:分数、根号、指数
eq <- expression(
  paste(
    frac(1, sigma*sqrt(2*pi)),
    " ",
    plain(e)^{frac(-(x-mu)^2, 2*sigma^2)}
  )
);
例2:bquote函数
x <- 1.24;
y <- 0.6;
ex <- bquote(
  .(
    parse(
        text = paste(
          "observed (",
          "italic(R)^2==",
          x,
          "^bold(", x, "),
          n == ", y,
          ")",
          sep = "  "
        )
    )
  )
);

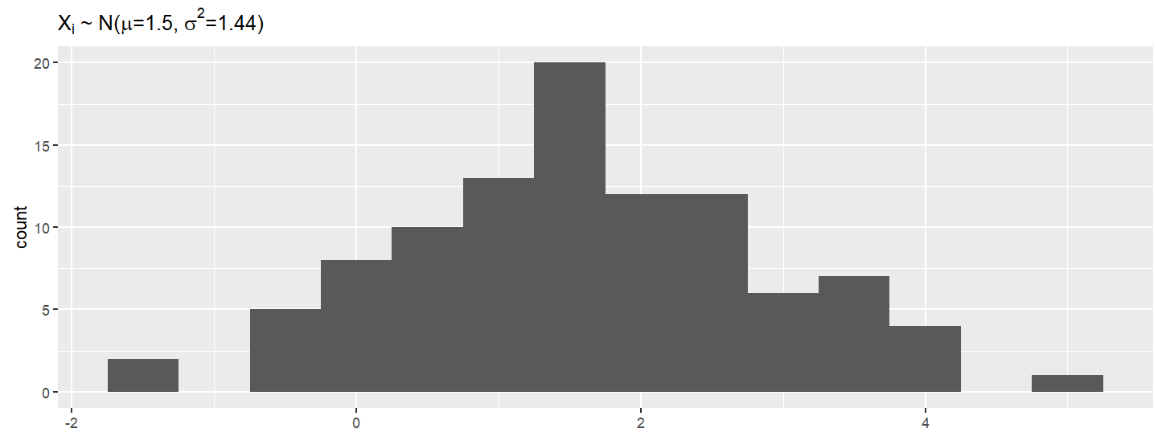
例3:ggtitle()指定标题不用写parse = T
x_mean <- 1.5;
x_sd <- 1.2;
ex <- substitute(
    paste(
      X[i],
      " ~ N(", mu, "=", m, ", ",
      sigma^2, "=", s2, ")"
    ),
    list(m = x_mean, s2 = x_sd^2)
);
ggplot( data.frame( x = rnorm(100, x_mean, x_sd) ), aes( x ) ) +
    geom_histogram( binwidth=0.5 ) +  # 直方图
    ggtitle(ex);  # 添加标题
先计算再做图–画图函数的计算方法
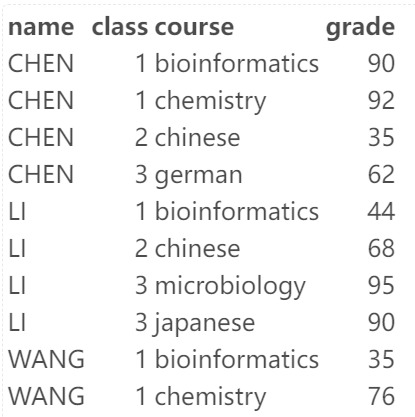
先看一个例子:
# 准备数据
grades2 <- read_delim( file = "data/grades2.txt", delim = "\t",
                       quote = "", col_names = T);
knitr::kable( grades2 );
现在要画出每位学生及格的课程数,使用filter筛选行即可
ggplot( grades2 %>% dplyr::filter( grade >= 60 ),
        aes( name ) ) +
  geom_bar();
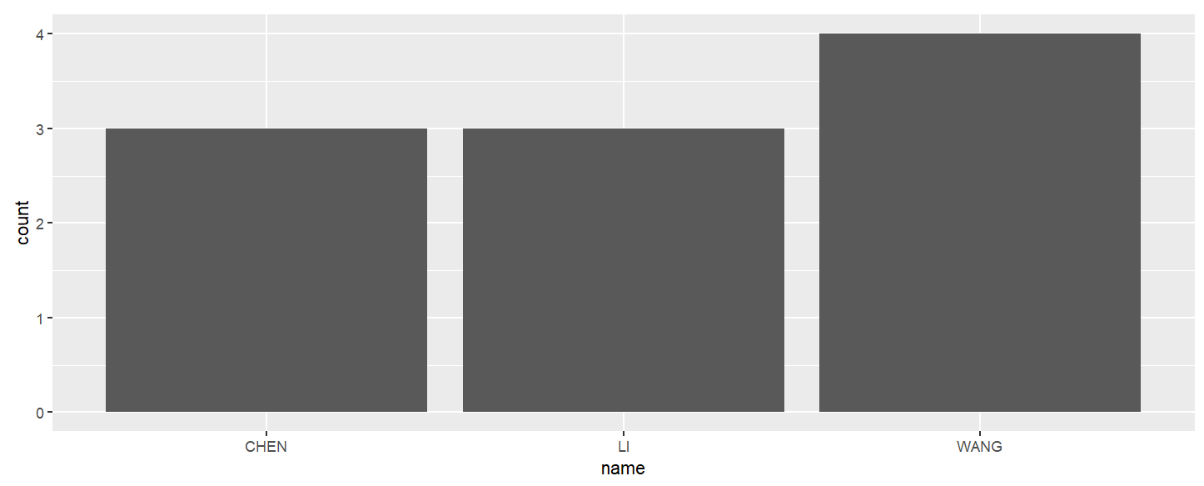
仔细观察上面的函数,我们只是筛选了行并给出了x轴取值,并没有分组和计算行数,但geom_bar()仍给出了正确的结果
这是因为geom_bar()中有一个默认的参数stat = "count",它表示画图函数对数据的统计方法,柱状图默认是按x轴的数据分组并计算行数
以上函数实际相当于:
# 先做统计
cnt <- grades2 %>%
  group_by( name ) %>%
  summarise( cnt = sum( grade >= 60 )  );
ggplot( cnt, aes( x = name, y = cnt ) ) +
  geom_bar( stat = "identity" );  # 取消默认统计方法,按指定的df画图
其它画图函数的默认计算方法:
-
geom_bar: count -
geom_boxplot: boxplot -
geom_count: sum -
geom_density: density -
geom_histogram: bin -
geom_quantile: quantile
position参数–以柱形图为例
堆叠柱状图(stacked bars)
应用场景:宏基因组多样本物种丰度图
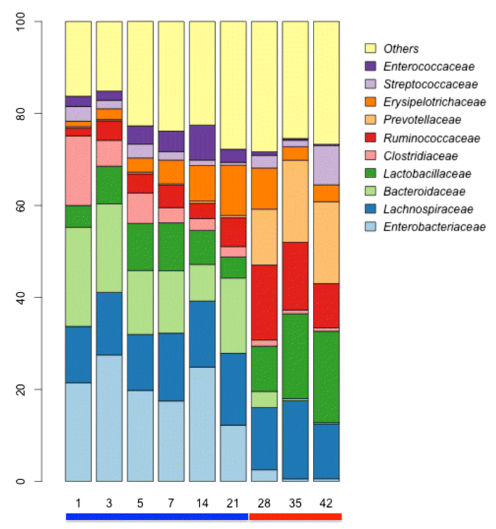
方法:为geom_bar()指定参数position = "stack"
例:
# 准备数据
speabu <-read_tsv( file = "data/mock_species_abundance.txt"  );
head( speabu );
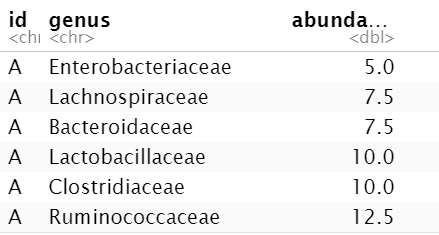
相同id的画一个柱子,柱子堆叠的每部分颜色不同(根据genus列来取),柱子高度由abundance列决定
ggplot( speabu, aes( x = id, y = abundance, fill = genus ) ) +
  geom_bar( stat = "identity", position = "stack", color = "black", width = 0.2 );
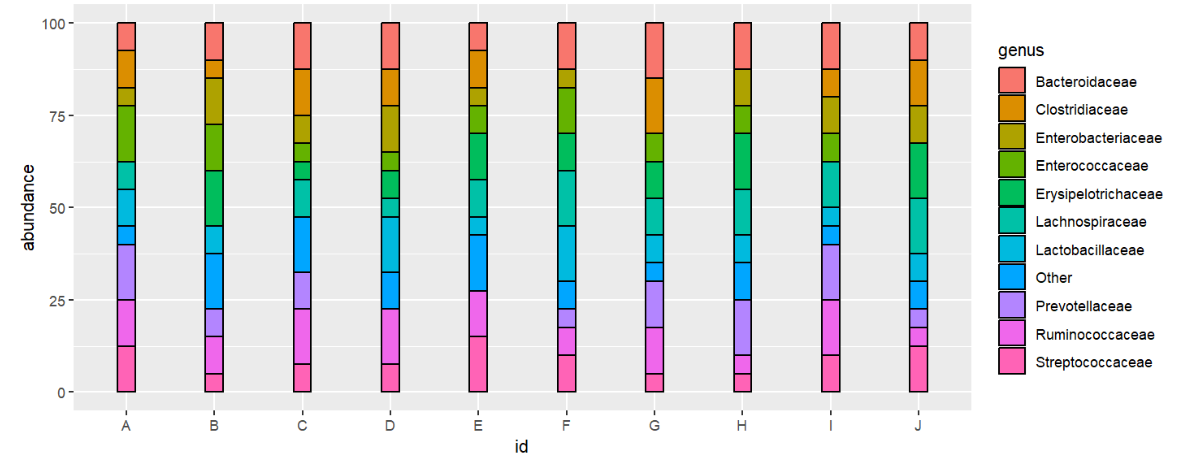
注意fill是填充色,而color是边框色
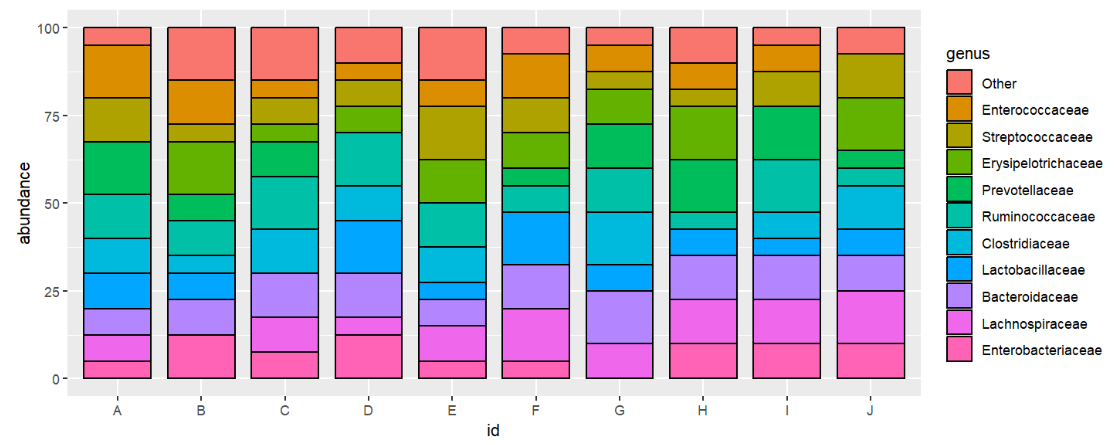
需求1:指定Genus展示顺序
思路:使用factor对Genus列进行重排
speabu$genus <- factor( speabu$genus,
                        levels = rev( c( "Enterobacteriaceae", "Lachnospiraceae", "Bacteroidaceae", "Lactobacillaceae", "Clostridiaceae",
                        "Ruminococcaceae", "Prevotellaceae", "Erysipelotrichaceae", "Streptococcaceae", "Enterococcaceae", "Other" ) ) );
ggplot( speabu, aes( x = id, y = abundance, fill = genus ) ) +
  geom_bar( stat = "identity", position = "stack", color = "black", width = 0.8 );
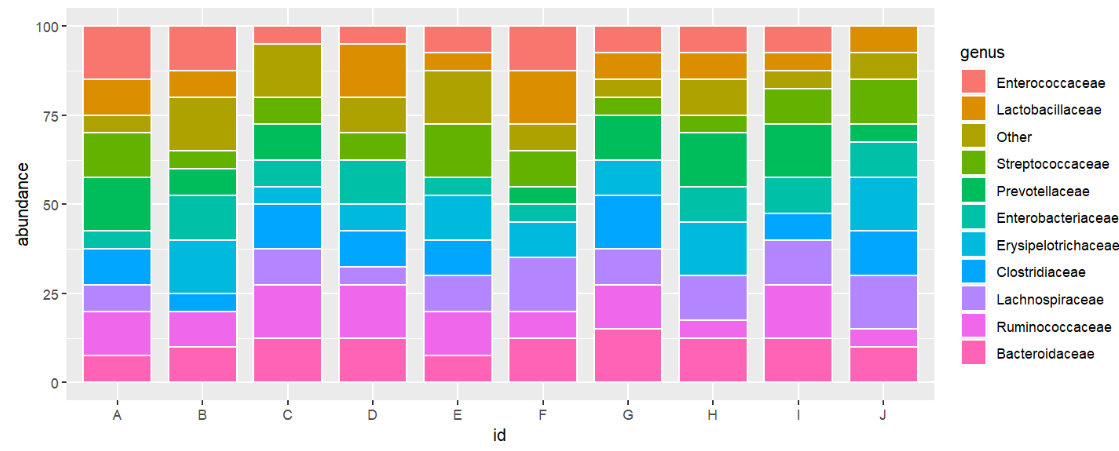
需求2:按丰度中值大小排序
使用reorder函数:reorder(返回结果列, 顺序决定列, 排序方法)
speabu$genus <- reorder( speabu$genus, speabu$abundance, median );
ggplot( speabu, aes( x = id, y = abundance, fill = genus ) ) +
  geom_bar( stat = "identity", position = "stack", color = "white", width = 0.8 );
需求3:显示数值
即每个堆叠部分的占比(abundance值)
# 先计算显示位置
speabu <- speabu %>%
  arrange( id, desc( factor( genus ) ) ) %>%  # 按id和genus排序
  group_by( id ) %>%  # 分组,让相同id的为一个柱子,每组单独计算位置
  mutate( ypos = cumsum( abundance ) - abundance / 2 );  # 累加,再减去一半的高度使文字居中
ggplot( speabu, aes( x = id, y = abundance, fill = genus ) ) +
  geom_bar( stat = "identity", position = "stack", color = "black", width = 0.8 ) +
  geom_text( aes( y = ypos, label = paste( abundance, "%", sep = "" ) ), color = "white" );
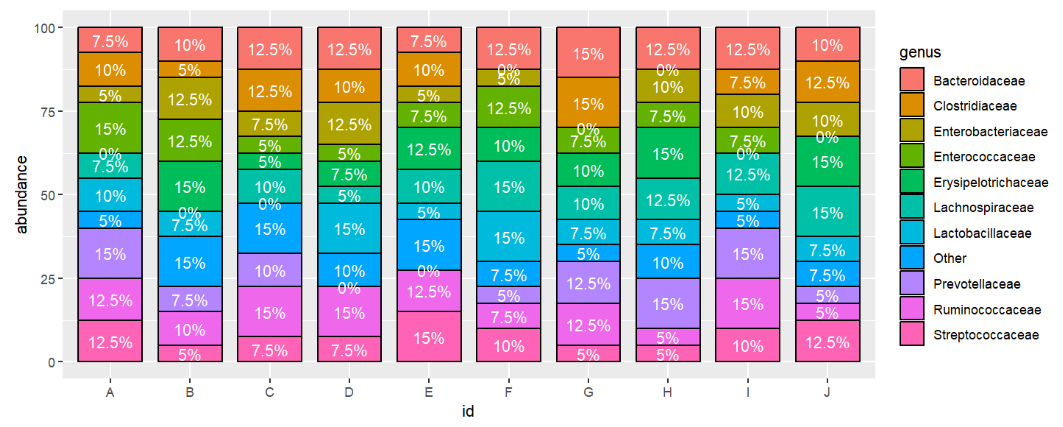
并列柱状图
即让每个柱子不堆叠,而是相邻排列
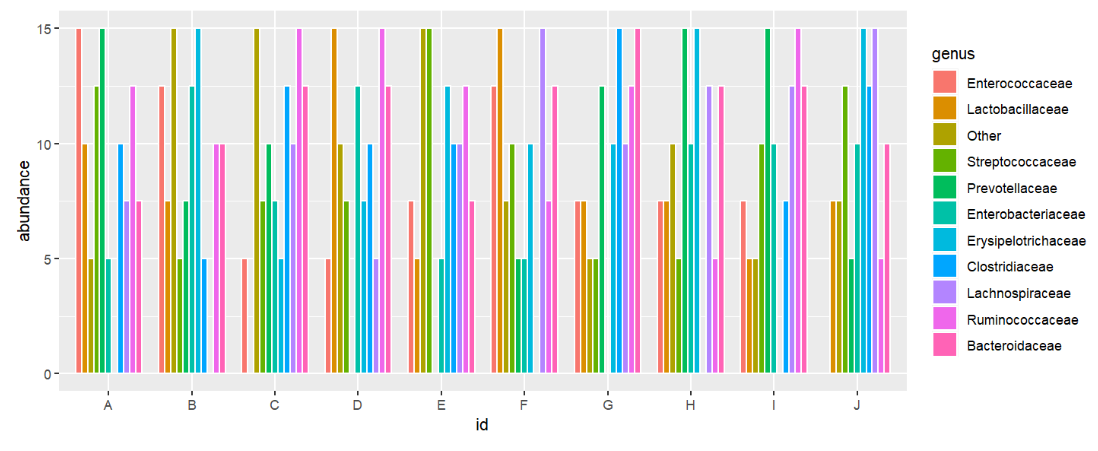
方法:为geom_bar()指定参数position = "dodge"或position=position_dodge()
ggplot( speabu, aes( x = id, y = abundance, fill = genus ) ) +
  geom_bar( stat = "identity", position = "dodge", color = "white", width = 0.8 );
如何为并列的柱状图显示数值:使用position_dodge位置调整文本位置
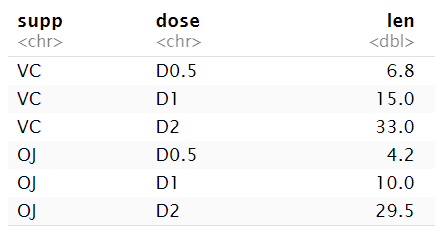
# 准备数据
df2 <- data.frame(supp=rep(c("VC", "OJ"), each=3),
               dose=rep(c("D0.5", "D1", "D2"),2),
              len=c(6.8, 15, 33, 4.2, 10, 29.5));
ggplot( df2, aes(x=factor(dose), y=len, fill=supp)) +
  geom_bar(stat="identity",
           position=position_dodge())+
  geom_text(aes(label=len), vjust=1.6, color="black", size=3.5,
            position = position_dodge(0.9))

通过修改position_dodge里面的参数,可以调整文字和柱子的位置
position的其它取值:
-
position = position_identity():在指定位置,不改变 -
position = position_jitter():随机往别的地方移动使点不重叠 -
position = position_nudge():平移
不同的画图函数有不同的默认position取值,比如柱形图是堆叠、箱型图是相邻
ggplot(ToothGrowth, aes(x=factor( dose ), y=len, fill=supp)) +
  geom_boxplot();

主题
一般分为两种调整主题的方式:
-
theme(...)自定义各个元素的样式 -
theme_xxx()直接使用已经定制好的内容,包括theme_bw、theme_linedraw、theme_light、theme_dark、theme_minimal、theme_classic、theme_void和默认主题theme_gray等
ggplot(ToothGrowth, aes(x=factor( dose ), y=len, fill=supp)) +
  geom_boxplot() + scale_fill_brewer( palette = "Paired" ) + theme_classic();
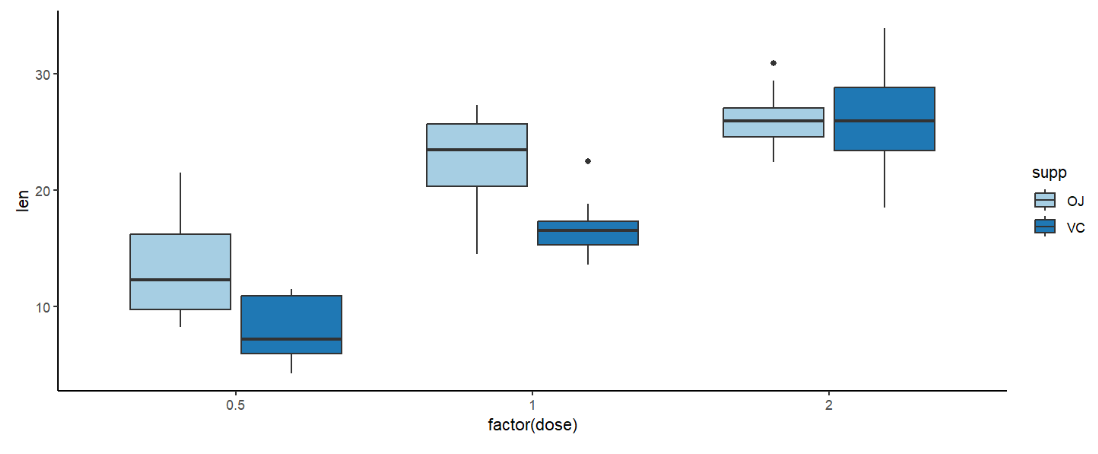
theme()函数:可用通式theme(主题.部件=element_类型()/具体值)表示
-
主题:
plot整幅图、axis坐标轴、legend图例、panel面板、facet子图 -
部件:
title名字,坐标轴名字、line线,坐标轴的xy轴,text标签,坐标轴刻度的数字、ticks坐标轴刻度的小线条、background背景、position位置、… -
类型:
rect区域、line线条、text文本
其中部件要和类型一致。如部件为title、text等文字相关的元素,那么类型处就应为text
除了theme函数,还有一些函数用于设置图样式,如labs:
labs(
  x = "<x label>",  # x轴标签
  y = "<y label>",  # y轴标签
  tag = "图标签",  # 常用于为每个子图添加对应标签
  colour = "<legend title>",  # 与aes里的colour配合使用
  fill = "<legend title>",  # 与aes里的fill配合使用
  shape = "<legend title>",  # 与aes里的shape配合使用
  ...,
)
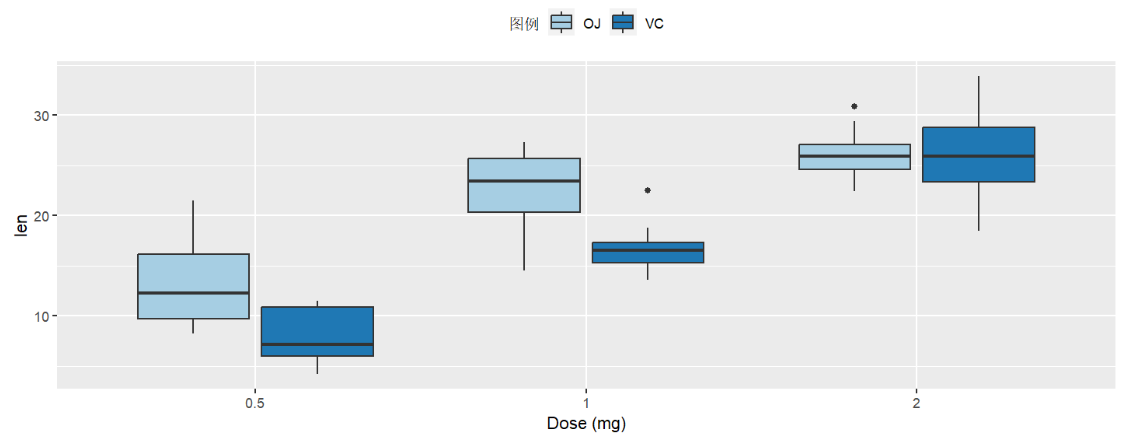
colour/fill/shape参数是为了给图例加标签,如果图在aes中按fill填充色进行区分并画图例,就使用fill参数给图例加标签
ggplot(ToothGrowth, aes(x=factor( dose ), y=len, fill=supp)) +
  geom_boxplot() +
  scale_fill_brewer( palette = "Paired" ) +
  labs( fill = "图例", x = "Dose (mg)" ) +
  theme( legend.position = "top" );  # 调整图例位置为顶部
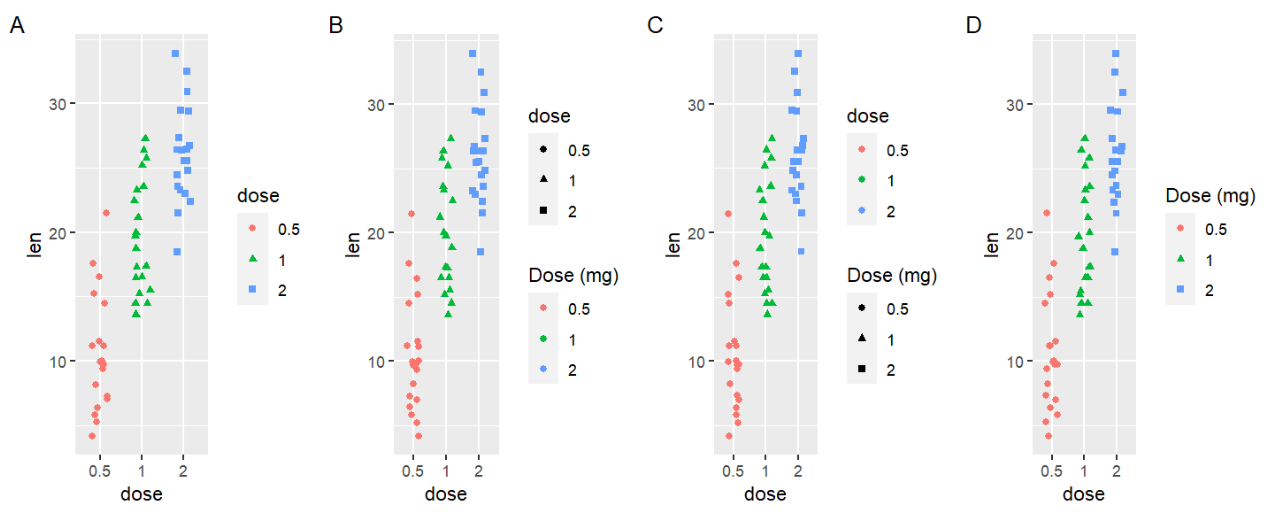
labs还可以同时为多个图例指定名称:
# 创建基础图
df <- ToothGrowth;
df$dose <- as.factor(df$dose);
sc <- ggplot(df, aes(x=dose, y=len, color=dose, shape=dose)) +
  geom_jitter(position=position_jitter(0.2))+
  theme(legend.position = "none") +
  theme_gray();
library("gridExtra");
grid.arrange(
  sc + labs( tag = "A" ),
  sc + labs( colour = "Dose (mg)" , tag = "B" ),
  sc + labs( shape = "Dose (mg)" , tag = "C" ),
  sc + labs( colour = "Dose (mg)", shape = "Dose (mg)", tag = "D" ),
  ncol=4, nrow =1
);
ggplot2实战
swiss
用swiss数据做图
每道题都有R基础作图函数和ggplot2两个版本
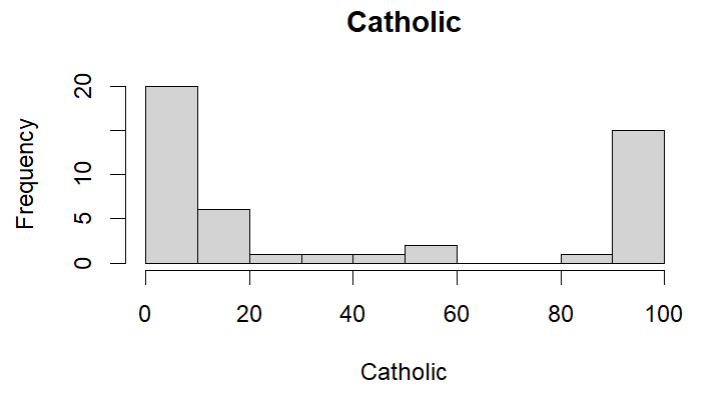
1.用直方图显示Catholic列的分布情况
基础作图函数:
hist(
  x = swiss$Catholic,  # 数据
  main = "Catholic",  # 标题
  xlab = "Catholic"  # x轴标签
);
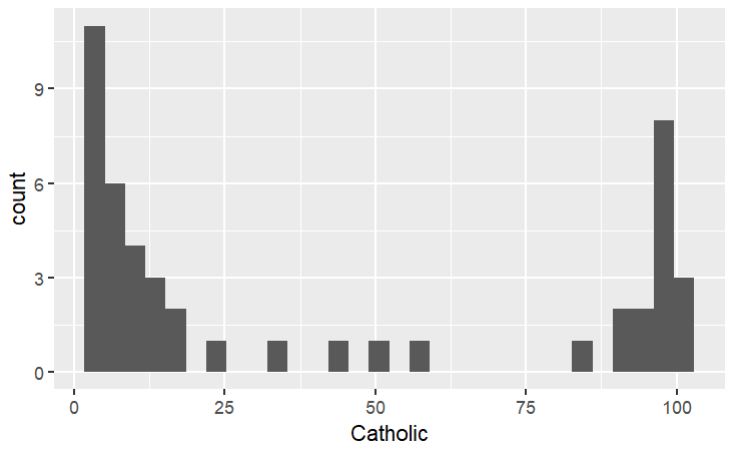
ggplot2:
ggplot(
  swiss,  # 使用的数据集
  aes( x = Catholic )  # 标明x轴的取自哪列
  ) +
  geom_histogram();  # 画直方图
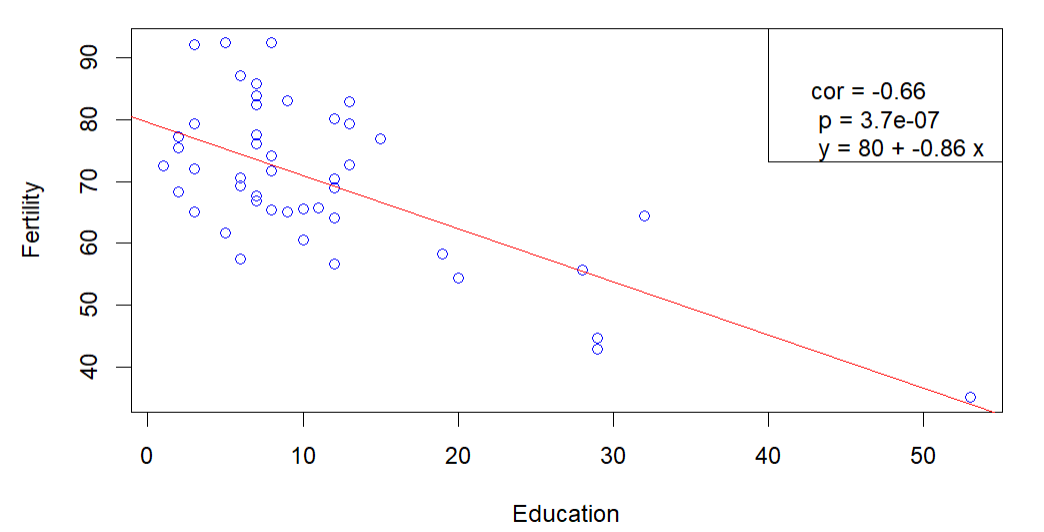
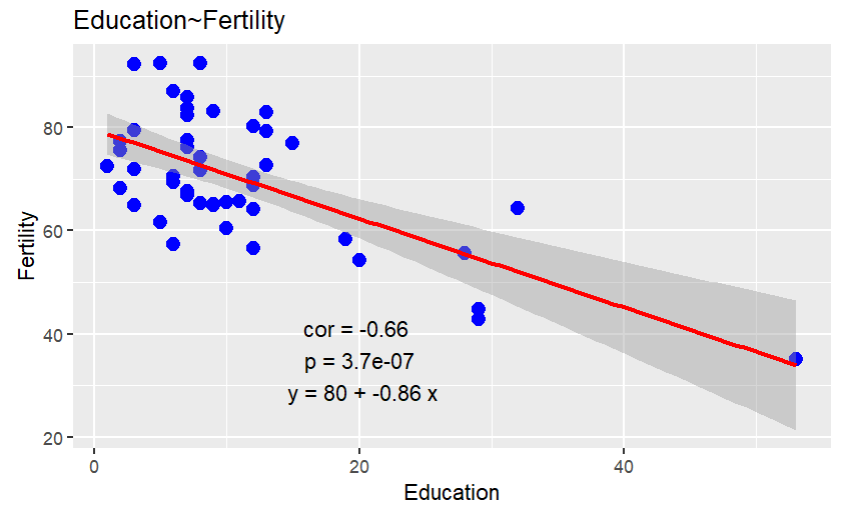
2.用散点图显示Eduction与Fertility的关系,同时将表示两者关系的线性公式、相关系数和p值画在图的空白处
因为要标注公式、相关系数和p值,所以首先要进行计算:
m <- lm(Fertility ~ Education,swiss);  # 线性回归
cor_val <- cor(swiss$Fertility, swiss$Education);  # 相关系数
p_val <- cor.test(swiss$Fertility,swiss$Education)$p.value;  # p值
a <- coef(m)[1];  # 回归线y=ax+b中的a
b <- coef(m)[2];  # 回归线y=ax+b中的b
基础作图函数:
with(swiss,plot(Education, Fertility, col = "blue"))  # 绘制基础散点图
abline(  # 添加拟合曲线
  lm(swiss$Fertility ~ swiss$Education),  # 回归线
  col="red"  # 线颜色
);
legend(  # 将文字作为图例进行添加
  "topright",  # 添加在右上角
  legend = paste(  # 图例内容
    "cor =", round(cor_val,2),  # 相关系数--保留2位小数
    "\n",
    "p =", format(p_val, scientific = T, digits = 2),  # p值--科学计数法,保留2位小数
    "\n",
    "y =",format(a ,digits = 2),"+",format(b ,digits = 2),"x",  # 公式,系数保留2位小数
    "\n"
  )
);
ggplot2:
ggplot(swiss, aes(x = Education, y = Fertility)) +
  geom_point(color = "blue", size = 3) +  # 绘制基础散点图
  geom_smooth(method = "lm", color = "red") +  # 添加拟合曲线
  labs(title = "Education~Fertility", x = "Education", y = "Fertility") +  # 标题和xy轴
  # 可以用之前讲过的as.expression(eq)方法添加,这里列举另一种添加方法
  annotate(  # 将文字作为注释进行添加
    "text",  # 声明注释的类型为文本
    x = 20, y = 35,  # 添加注释的位置
    label = paste(  # 注释内容--与基础作图函数中的相同
      "cor =", round(cor_val,2),
      "\n",
      "p =", format(p_val, scientific = T, digits = 2),
      "\n",
      "y =",format(a ,digits = 2),"+",format(b ,digits = 2),"x"
    )
  );
iris
用iris数据做图
每道题都有R基础作图函数和ggplot2两个版本
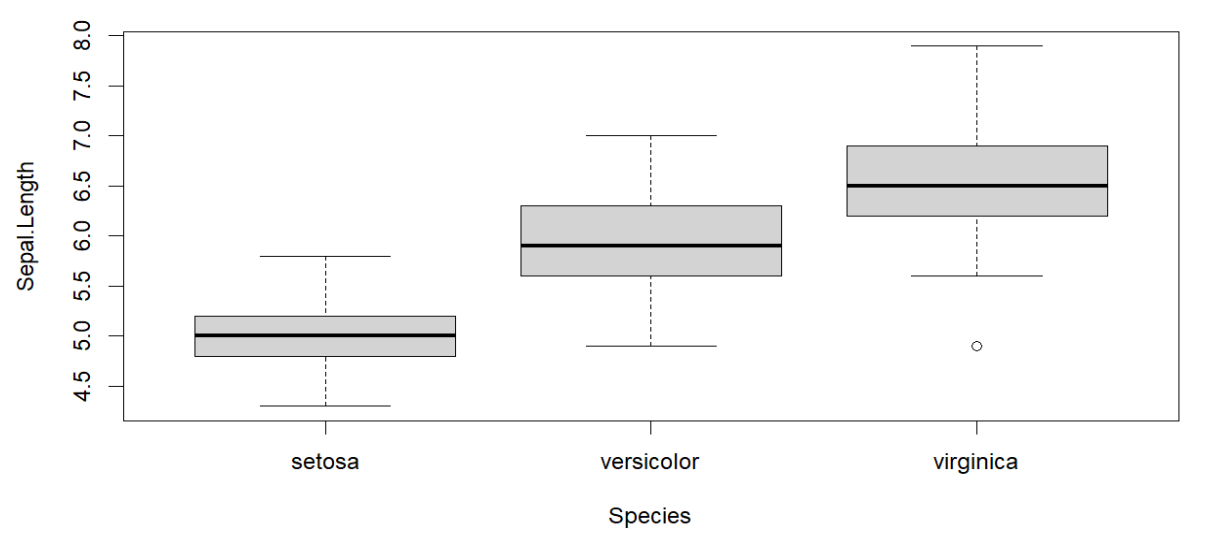
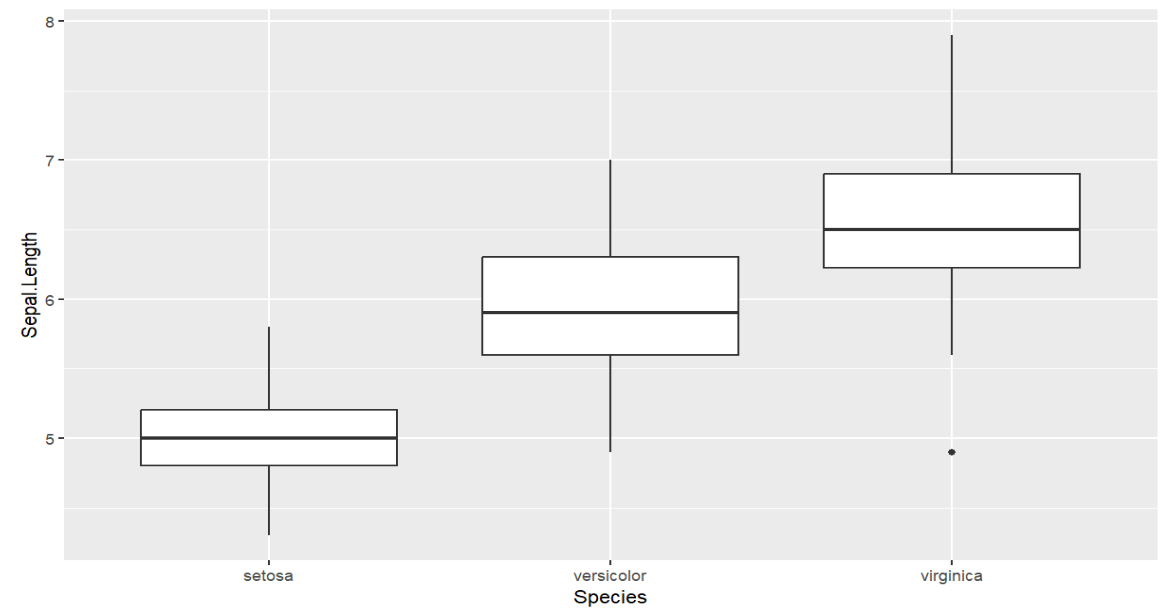
1.用箱型图显示不同species的Sepal.Length的分布情况
即x轴为species,y轴为Sepal.Length
基础作图函数:
boxplot(Sepal.Length ~ Species, data = iris);
ggplot2:
ggplot(iris, aes(x = Species, y = Sepal.Length))+  # 指定数据集和xy轴
  geom_boxplot();  # 画箱型图
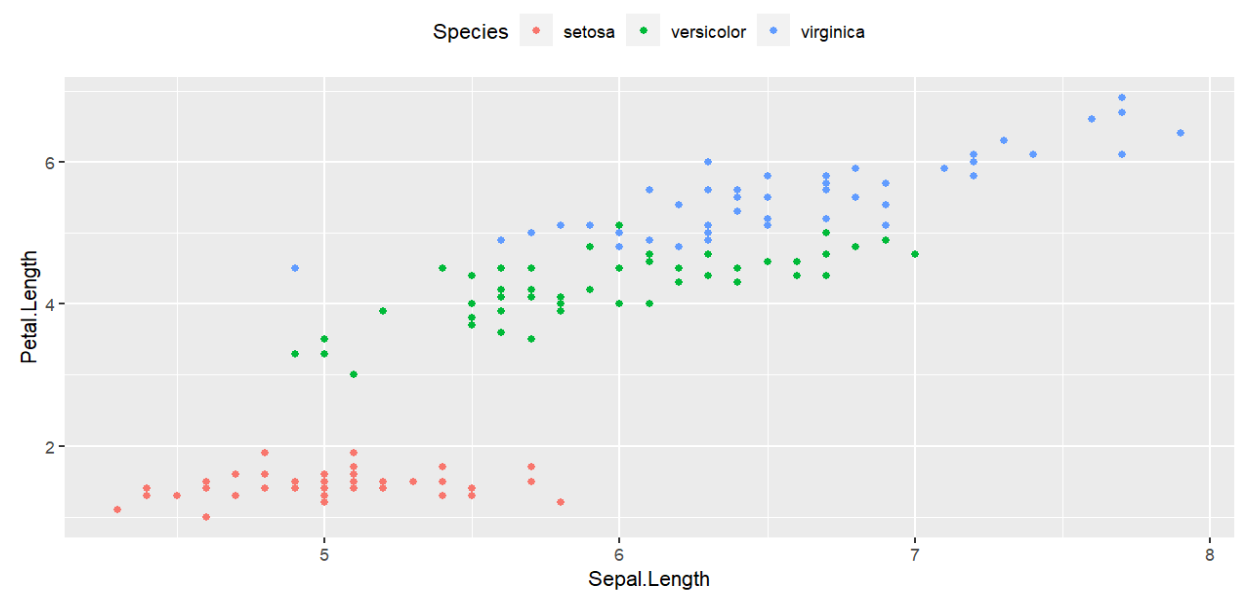
2.用散点图显示Sepal.Length和Petal.Length之间的关系,并根据species为点添加颜色,同时显示图例标明哪种颜色对应哪种species
基础作图函数:
因为基础作图函数不能自动根据某列分组指定颜色,需要我们手动建立物种与颜色的对应,方法:给vector中的元素命名,使其成为一个类似于字典的数据结构
colors <- c(
  "setosa" = "black",
  "versicolor" = "red",
  "virginica" = "green"
);  # 物种与颜色的对应
with(
  iris,
  plot(  # 散点图
    Sepal.Length, Petal.Length,  # 数据
    col = colors[Species],  # 按物种分配颜色
    pch = 19,  # 设置颜色为填充色,而不是边缘颜色
    xlab = "Sepal.Length",
    ylab = "Petal.Length"  # 设置xy轴标题
  )
);
legend(
  "topleft",  # 设置图例位置
  legend = levels(iris$Species),  # 设置图例中的标签来自iris$Species
  col = colors,  # 按之前的对应设置颜色
  pch = 19,  # 颜色为填充色
  cex = 0.8,  # 调整图例大小
  x.intersp = 0.3,
  y.intersp = 0.3,  # 图例每个标签的xy间距
  text.width = 0.3  # 文本宽度
);
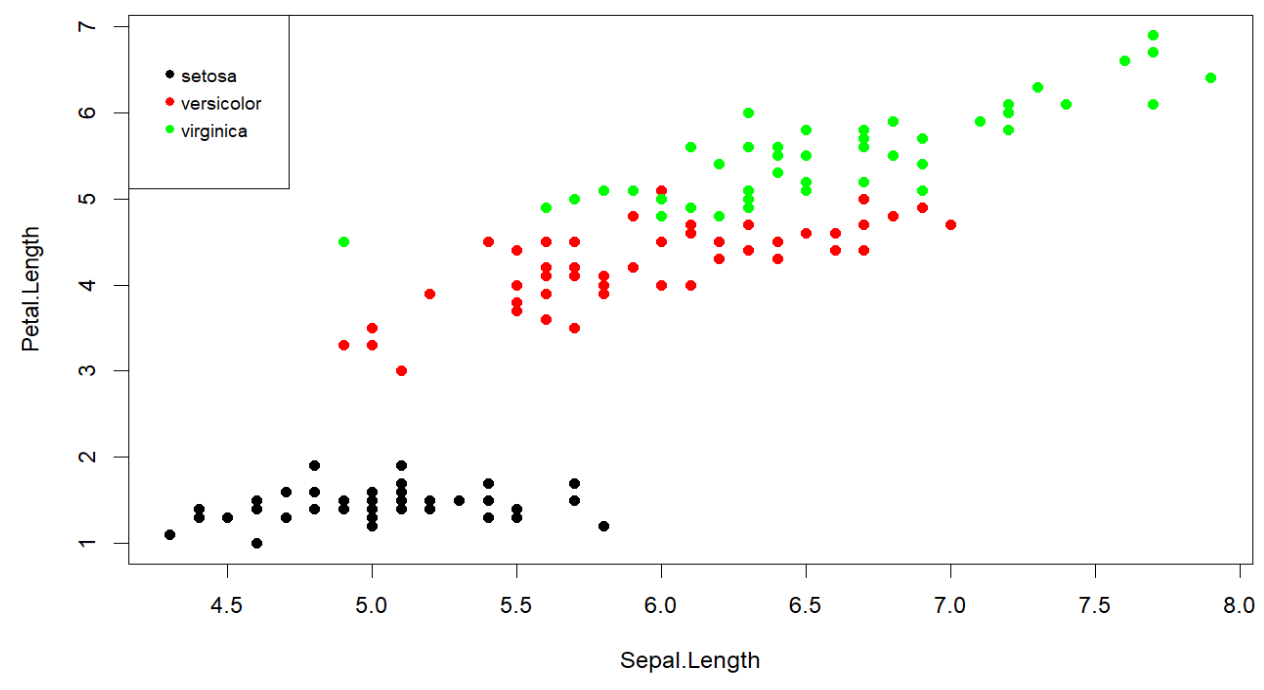
注:colors[Species]是在画图时按colors这个对应关系给物种标注颜色。如果只写col=colors,效果等效于colors <- c("red","green","blue")(每个点循环使用这3个颜色)
ggplot2:
ggplot(
  iris,  # 数据
  aes(
    x = Sepal.Length,
    y = Petal.Length,  # 指定xy轴数据
    color = Species  # 按物种分颜色
  ),
  labs(x = Sepal.Length,y = Petal.Length)  # 设置xy轴标签
) +
  geom_point() +  # 画散点图
  theme(legend.position = "top");  # 设置图例位置
箱型图
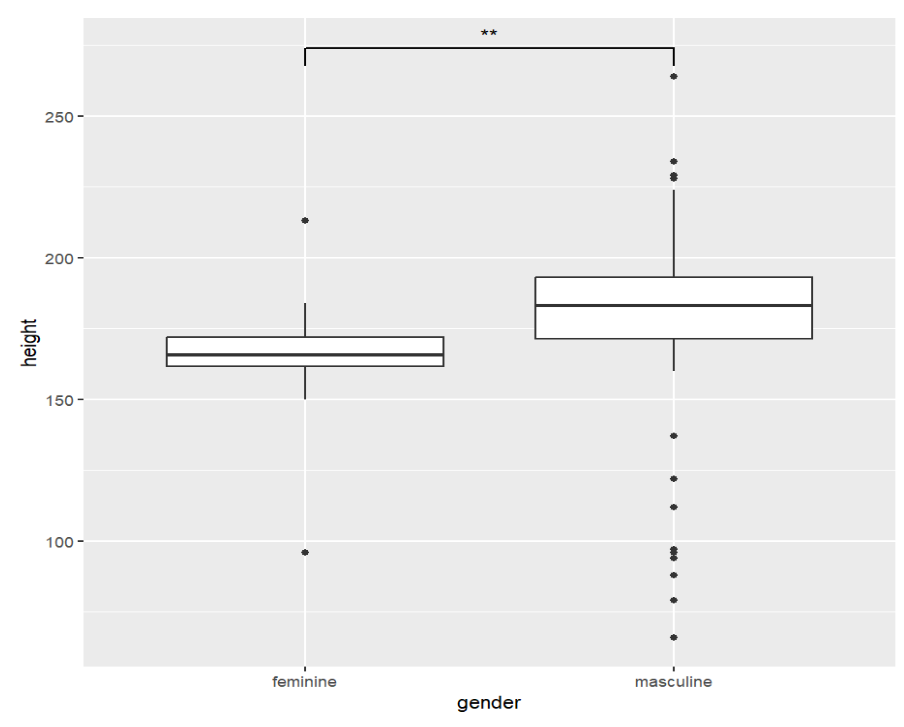
使用ggplot2:显示starwars中身高height与性别gender的关系
要求:
-
去掉height为NA的数据
-
用ggsignif包计算两种性别的身高是否有显著区别,并在图上显示
-
将此图的结果保存为变量
p1
思路:使用dplyr::filter筛选行,条件为没有na的height和gender;之后使用geom_boxplot创建箱型图,并使用geom_signif函数进行分析
starwars_noNA <- starwars %>%  # 获取没有NA的数据
  dplyr::filter(
    is.na(height)==FALSE & is.na(gender)==FALSE
  );
base_boxplot <-
  ggplot(  # 传入数据
    starwars_noNA,
    aes(x = gender, y = height)
  ) +
  geom_boxplot() +  # 箱型图
  labs(x = "gender", y = "height");  # xy轴标签
library(ggsignif);
p1 <- base_boxplot +
  geom_signif(
    comparisons = list(c("feminine", "masculine")),  # 设置需要比较的组
    map_signif_level = T  # 将图像上方的p值以*代替
  );
p1;
二维密度图
使用ggplot2
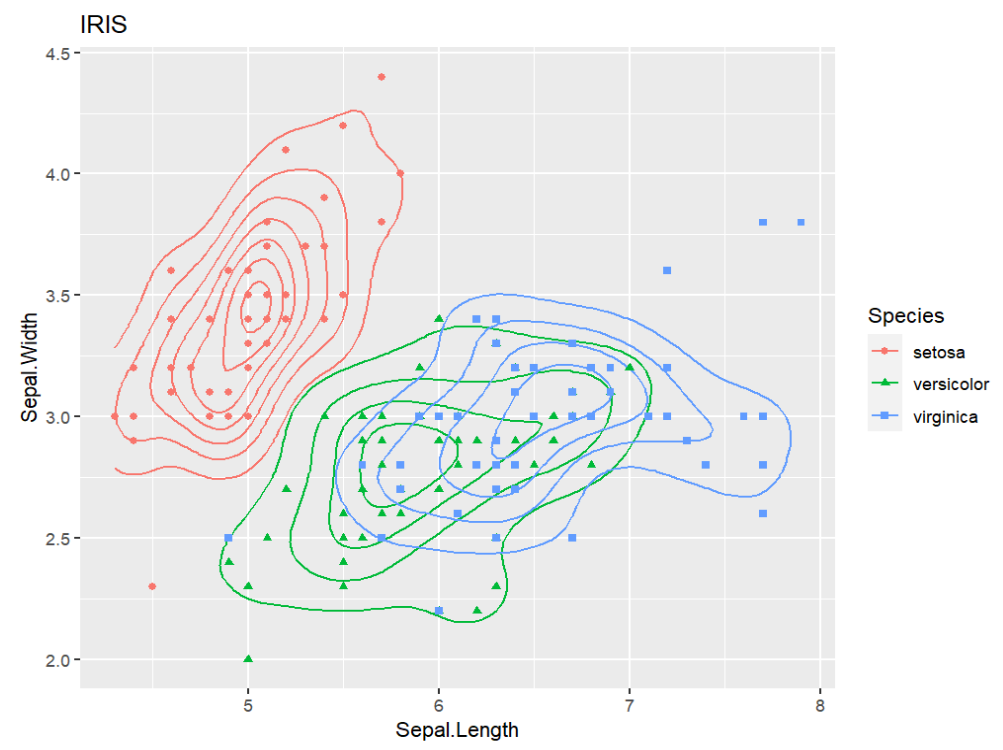
用二维密度图和散点图显示iris中Sepal.Length列和Sepal.Width之间的关系,同时按Species分组
-
二维密度图:使用
geom_density2d函数 -
将此图的结果保存为变量
p2
p2 <- ggplot(  # 传入数据
  iris,
  aes(
    x = Sepal.Length,
    y = Sepal.Width,  # xy轴数据
    color = Species,  # 颜色按物种分组
    shape = Species  # 点形状也按物种分组
  )
) +
  geom_density2d() +  # 画二维密度图
  geom_point() +  # 画散点图
  labs(title = "IRIS");  # 添加标题
p2;
facet子图
使用ggplot2
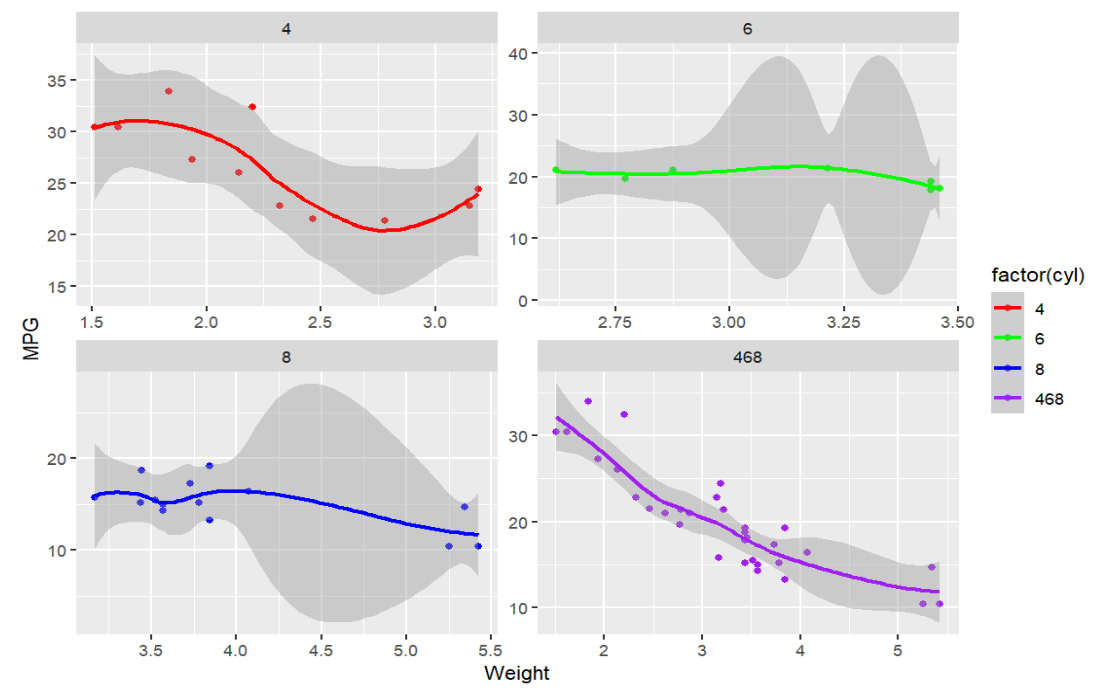
1.画散点图,显示mtcars中wt和mpg之间的关系,同时按cyl将数据分组画多个子图
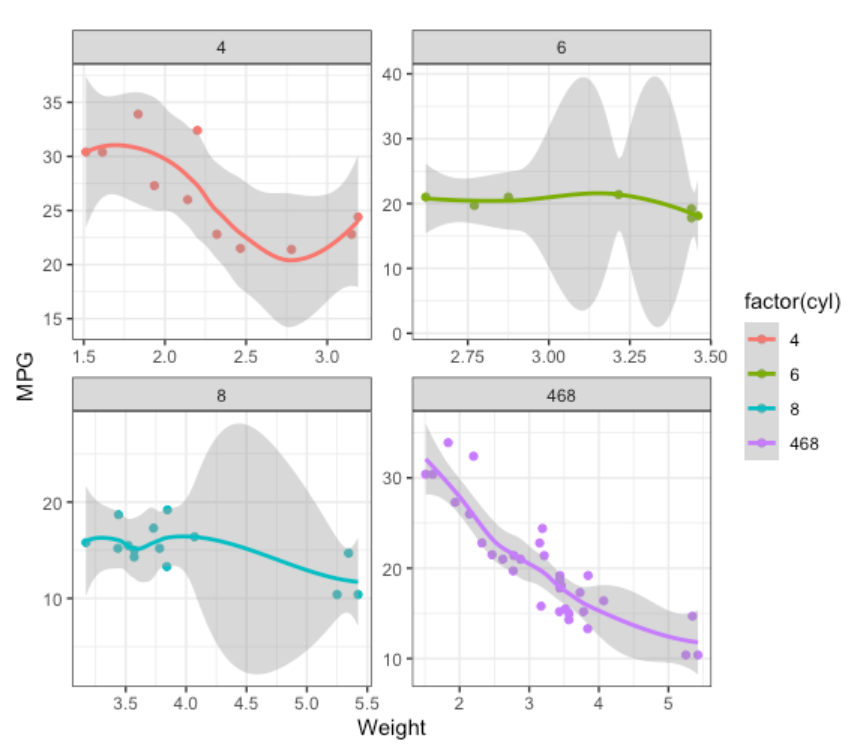
-
画出拟合曲线、图例、各图的名称
-
图中的
468组为所有数据合在一起的结果 -
将此图的结果保存为变量
p3
思路:新建一个数据集mtcars_new,由mtcars和mtcars_468合并而来。mtcars_new就是把mtcars中的cyl列值全改成468,因为facet_wrap函数要按cyl分组,这样才能分为4、6、8、468四组,其中468组包含全部mtcars全部数据
rm(mtcars);  # 重置mtcars数据集
mtcars_old <- mtcars;  # 保存原mtcars
mtcars$cyl <- 468;  # 更改列值
mtcars_468 <- mtcars;  # 保存新mtcars
mtcars_new <- dplyr::bind_rows(mtcars_old, mtcars_468)#合并
p3 <- ggplot(  # 传入数据
  mtcars_new,
  aes(
    x = wt, y = mpg,
    col = factor(cyl)  # 颜色按cyl分组
  )
) +
  geom_point() +  # 画散点图
  geom_smooth() +  # 添加拟合曲线
  scale_color_manual(  # 手动设置颜色
    breaks = c("4", "6", "8", "468"),
    values = c("red", "green", "blue", "purple")
    # breaks与values一一相对(cyl=4的颜色是red)
  ) +
  labs(x = "Weight",y = "MPG") +  # 添加xy轴标签
  facet_wrap(  # 画子图
    .~cyl,  # 按cyl分成多列
    ncol = 2,  # 列数为2
    scales = "free",  # 设置xy轴不统一
    dir = "h"  # 按水平方向排布,即第一行是46第二行是8,若是v第一行就是48
  );
p3;
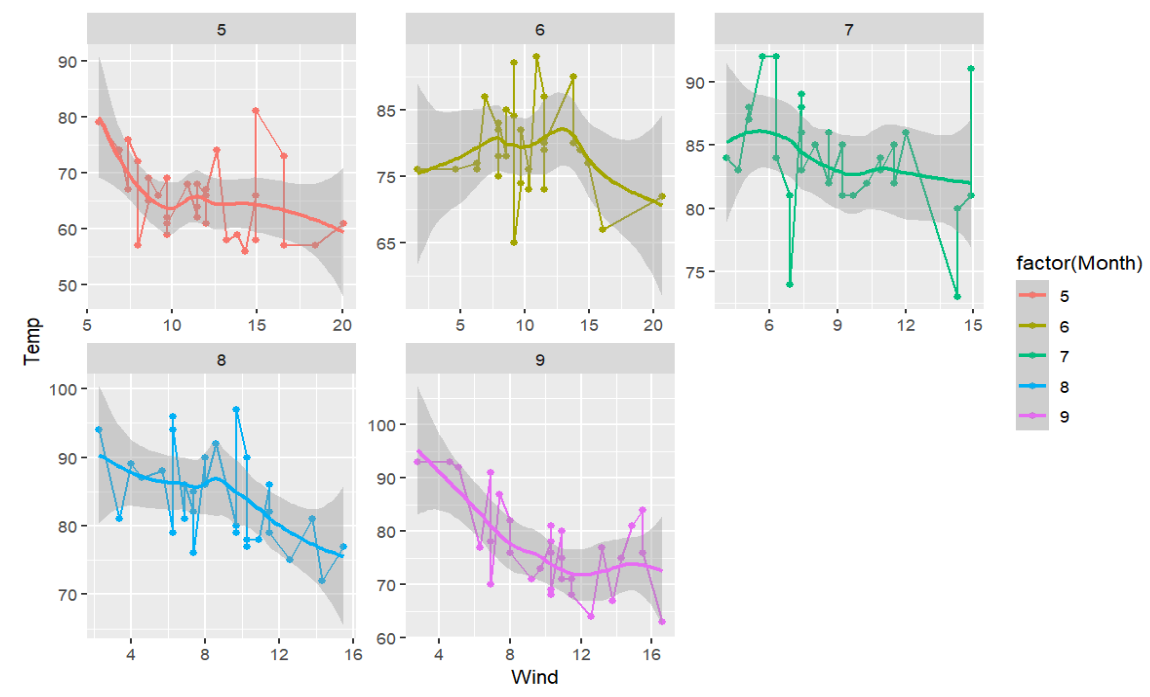
2.画点线图,显示airquality中Wind和Temp之间的关系,同时按Month将数据分组画多个子图
-
画出拟合曲线、图例、各图的名称
-
子图按2行3列组织
ggplot(  # 传入数据
  airquality,
  aes(
    x = Wind,y = Temp,
    col = factor(Month)  # 按月份分组
  )
) +
  geom_line() +  # 折线图
  geom_point() +  # 散点图
  geom_smooth() +  # 添加拟合曲线
  labs(x = "Wind", y = "Temp") +  # 添加xy轴标签
  facet_wrap(  # 画子图
    .~Month,  # 按Month分成多列
    ncol = 3,  # 列数为3
    scales = "free",  # 设置xy轴不统一
    dir = "h"  # 按水平方向排布
  );
极坐标图(polar图)
使用mtcars的mpg列
-
先按
cyl分组,由cyl确定每个柱子的颜色 -
每个组内按
mpg排序 -
将此图的结果保存为变量
p4
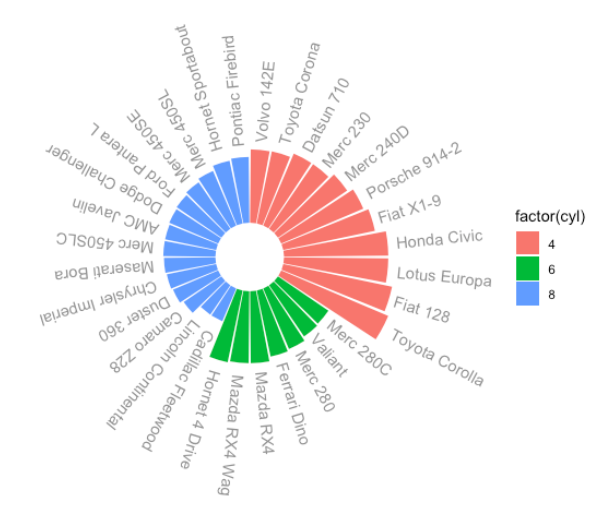
先看看我们要使用的数据:
rm(mtcars)  # 重置mtcars
mtcars <- mtcars %>% select(cyl, mpg);
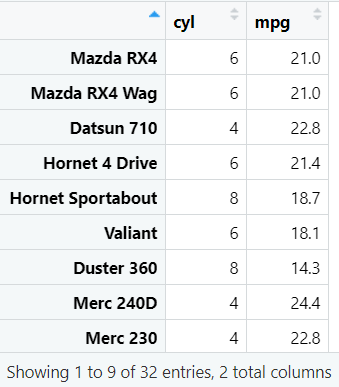
可以看到行名是汽车名称,即结果图中的文字内容
数据初处理:
-
为了方便后续增添文本,将行名单独成一列,使用
rownames_to_column函数 -
分组并排序
data <- mtcars %>%
  rownames_to_column() %>%
  arrange(cyl,mpg);
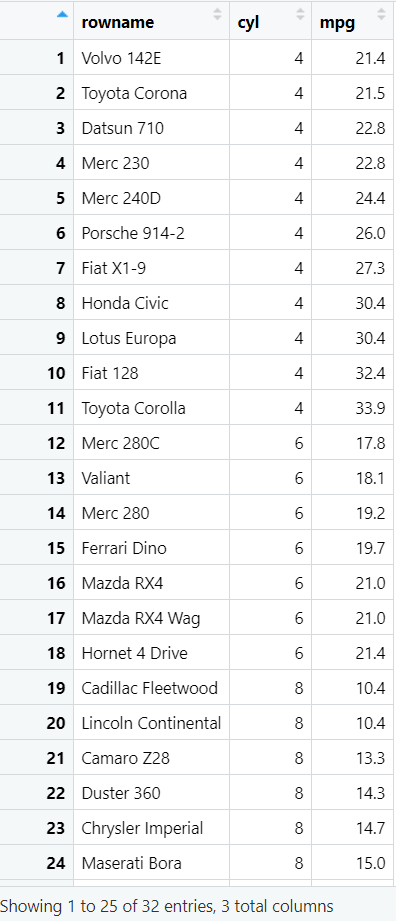
arrange(cyl,mpg):以cyl为主序,mpg为次序进行排序。即先排cyl,再在其基础上排mpg。可以看成先按cyl分组,再在组内排序mpg
注:不能写group_by(cyl)再arrange(mpg),因为group_by是针对summary这类汇总函数的,这样排序后结果是只按mpg排的,不能体现分组
data <- mtcars %>%
    group_by(cyl) %>%
    arrange(mpg);
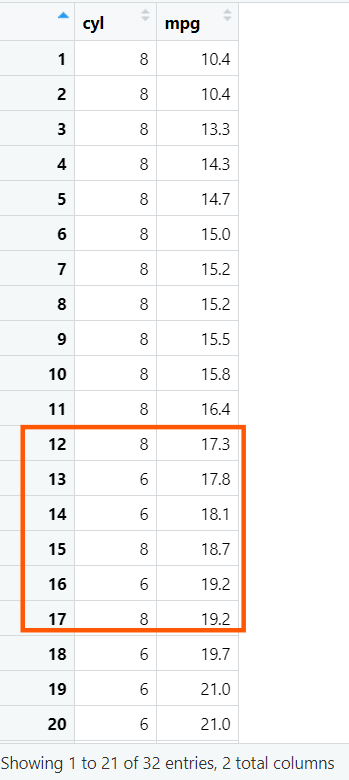
向量化索引列:将rowname列(汽车名称)改成向量形式
data$rowname <- factor(
  data$rowname,
  levels = data$rowname
);
这样做是为了固定每行的顺序,防止画图函数使用默认排序方法将顺序变乱。如果不加这一段代码:
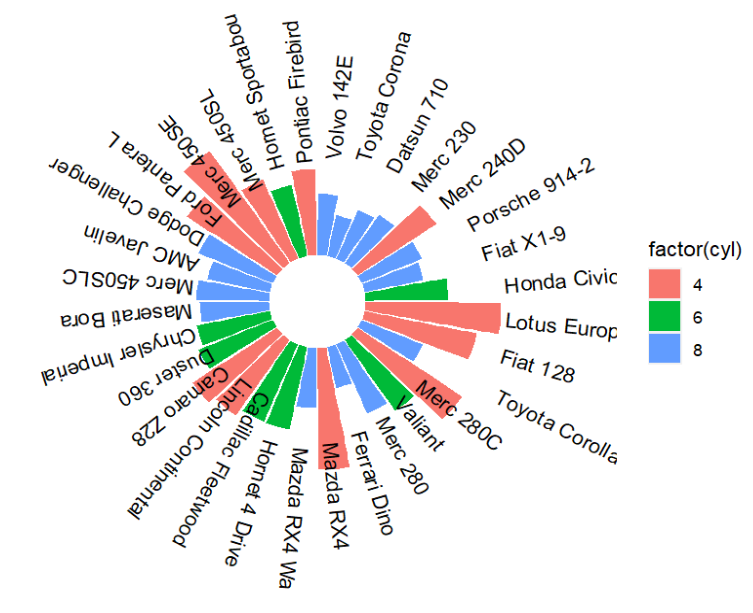
计算文本角度:使用angle = 90 - 360 * (id - 0.5) / n(),其中id是行索引(是第几行)
data <- data %>%
  mutate(
    id = row_number(),  # 行索引
    angle = 90-360*(id-0.5)/n()  # 文本角度
  );
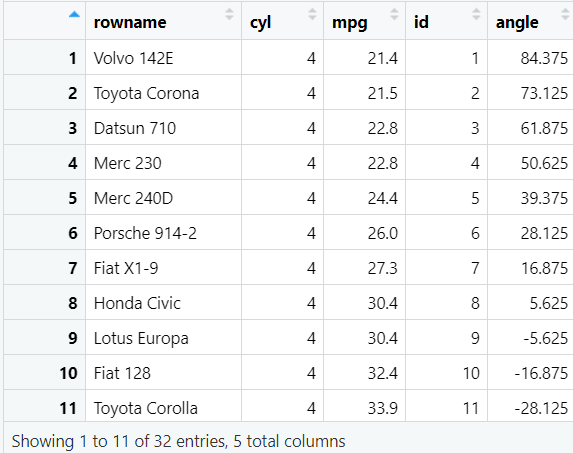
画图:
-
传入数据:xy轴分别是汽车名称和
mpg,填充颜色fill为cyl -
使用
geom_bar画基础柱状图,注意因为我们这里直接是按cyl的值确定柱子高度,所以要加上stat = "identity" -
使用
coord_polar将x轴变为圆形,这是画任何polar图必须的一步 -
添加文本,注意添加
aes(x=1:length(data$rowname)为文本设置基础坐标 -
其它微调
-
scale_y_continuous修改y轴范围(即起始值和结束值),它们分别对应中间空白圆大小、柱子长短 -
不显示主网格线(平行xy轴的那些刻度线)
-
不显示刻度和xy轴刻度文本
-
不显示xy轴名称
-
去掉图背景的阴影(详见下面的函数)
-
p4 <- ggplot(  # 传入数据
  data,
  aes(
    x = rowname,
    y = mpg,
    fill = factor(cyl)  # 指定填充颜色
  )
) +
  geom_bar(stat = "identity") +  # 基础柱状图
  coord_polar(theta = "x",start = 0) +  # 调整坐标轴
  geom_text(  # 添加文本
    aes(
      x = 1:length(data$rowname),  # 基础坐标
      label = data$rowname,  # 文本内容
      angle = data$angle,  # 角度
      hjust = -0.1  # 标签距中心距离
    )
  ) +
  scale_y_continuous(  # 修改y轴范围
    expand = c(0.01, max(data$mpg)/3)
  ) +
  theme(  # 不显示主网格线
    panel.grid.major = element_blank(),
    panel.grid.minor = element_blank()
  ) +
  theme(  # 不显示刻度和xy轴刻度文本
    axis.ticks = element_blank(),
    axis.text.y = element_blank(),
    axis.text.x = element_blank()
  ) +
  labs(x = "", y = "") +  # 不显示xy轴名称
  theme(  # 去掉图背景的阴影
    panel.background = element_rect(fill = "transparent",colour = NA),
    plot.background = element_rect(fill = "transparent",colour = NA)
  );
p4;
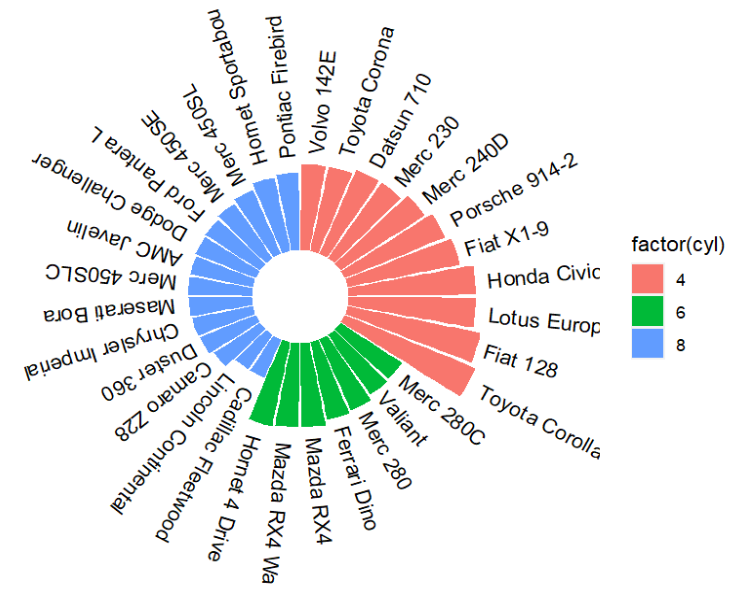
一个细节:传入数据时为什么要用fill = factor(cyl)?
如果fill设置颜色时不加factor,使用fill = cyl:
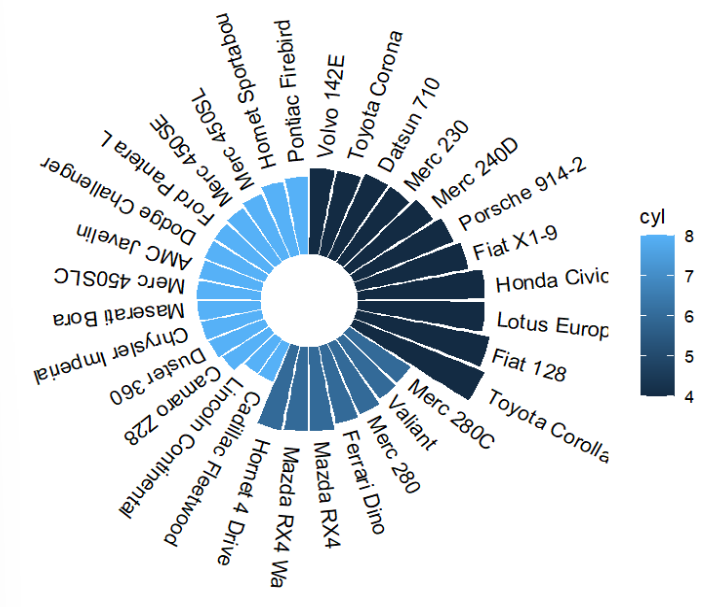
这是因为画图函数将cyl看成了连续变量,而我们想让它作为离散变量,因此用factor处理
代码汇总:
rm(mtcars);
data <- mtcars %>%
  rownames_to_column() %>%
  arrange(cyl,mpg);
data$rowname <- factor(data$rowname, levels = data$rowname);
data <- data %>%
  mutate(id = row_number(),
         angle = 90-360*(id-0.5)/n());
p4 <- ggplot(data, aes(x = rowname, y = mpg,
                       fill = factor(cyl))) +
  geom_bar(stat = "identity") +
  coord_polar(theta = "x",start = 0) +
  geom_text(aes(x = 1:length(data$rowname),
                label = data$rowname,
                angle = data$angle,
                hjust = -0.1)) +
  scale_y_continuous(expand = c(0.01, max(data$mpg)/3)) +
  theme(panel.grid.major = element_blank(),
        panel.grid.minor = element_blank()) +
  theme(axis.ticks = element_blank(),
        axis.text.y = element_blank(),
        axis.text.x = element_blank()) +
  labs(x = "", y = "") +
  theme(panel.background = element_rect(fill = "transparent",colour = NA),
        plot.background = element_rect(fill = "transparent",colour = NA));
p4;
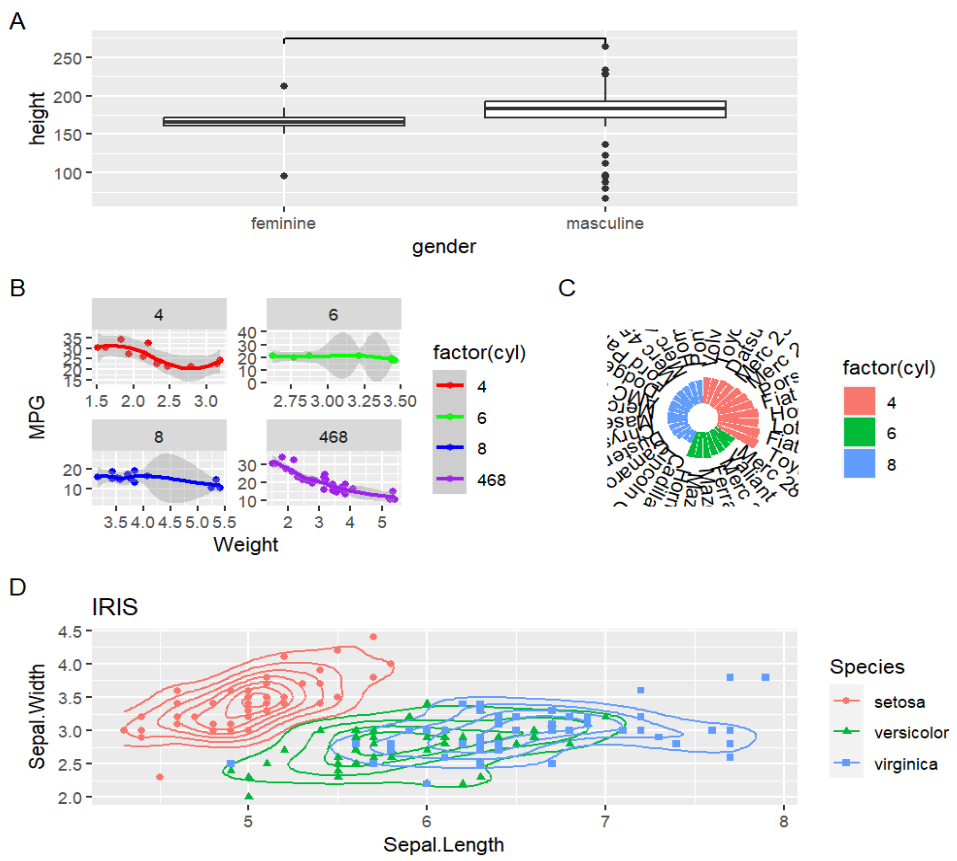
多图组合
cowplot包
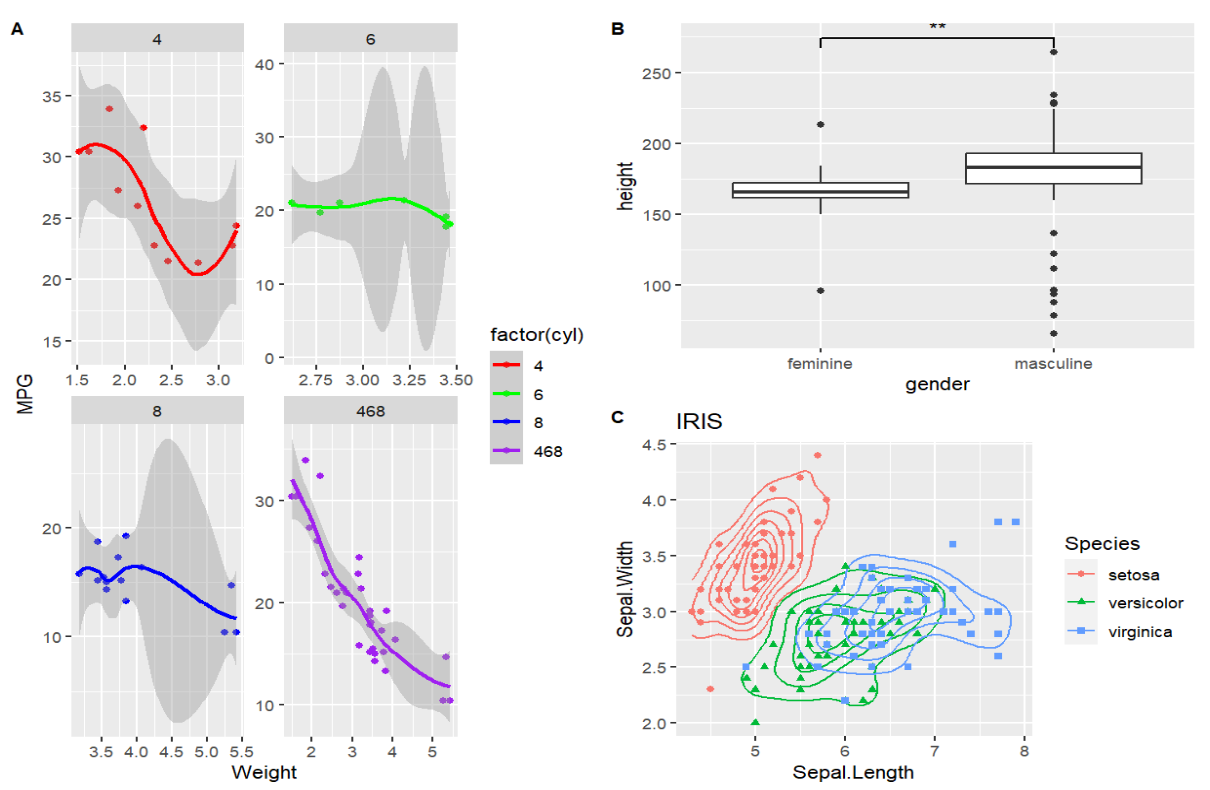
用cowplot::ggdraw将p1、p2和p3按下面的方式组合在一起
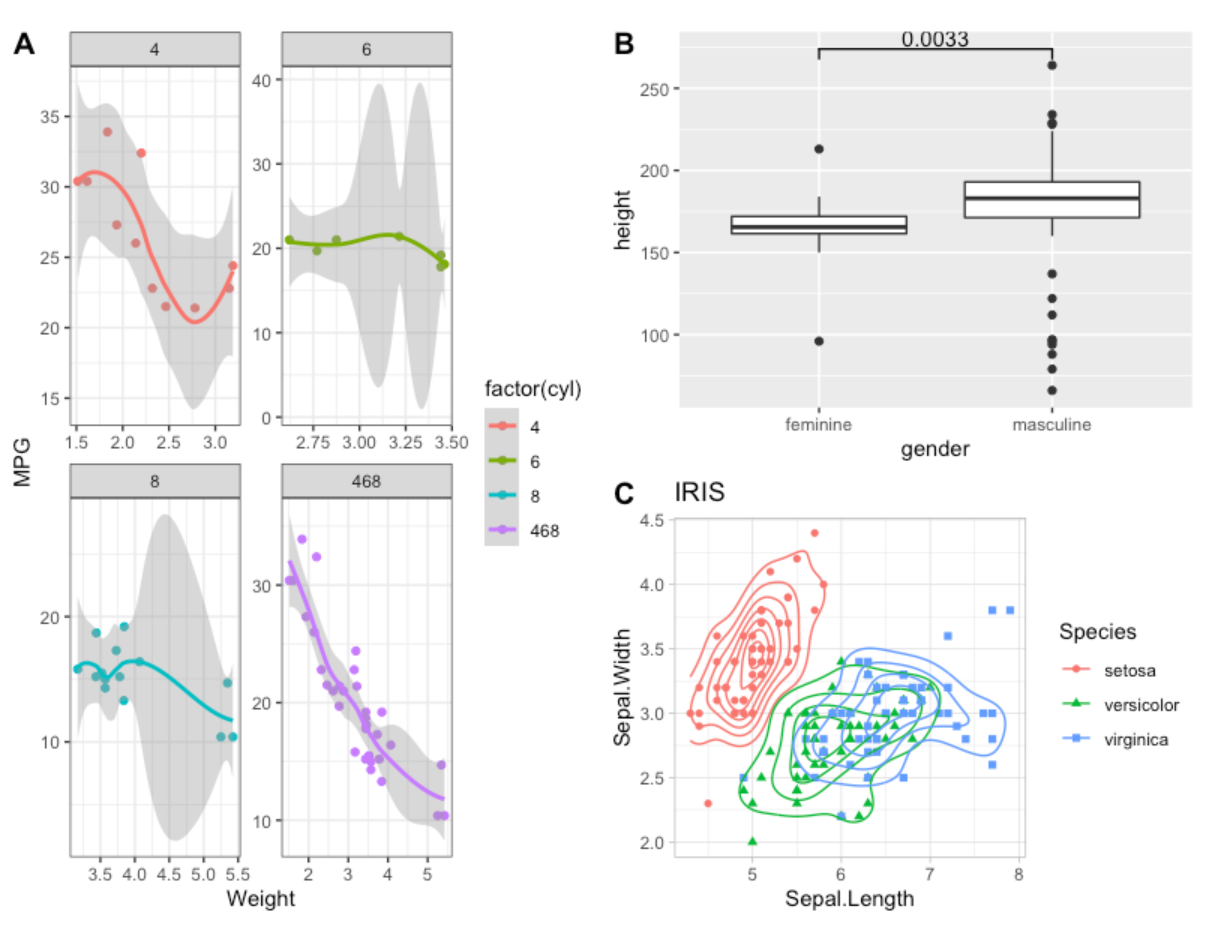
关键:以左下角为原点,右、上为正方向,为每张图指定的坐标也是以左下角为准
-
A(p3):(0, 0),宽为0.5,高为1
-
B(p1):(0.5, 0.5),宽为0.5,高为0.5
-
C(p2):(0.5, 0),宽为0.5,高为0.5
-
标签:ABC坐标分别为(0, 1)、(0.5, 1)、(0.5, 0.5)
library(cowplot);
ggdraw() +  # 创建画板
  draw_plot(p3, x = 0, y = 0, width = 0.5, height = 1) +
  draw_plot(p1, 0.5, 0.5, 0.5, 0.5) +
  draw_plot(p2, 0.5, 0, 0.5, 0.5) +
  draw_plot_label(c("A", "B", "C"), c(0, 0.5, 0.5), c(1, 1, 0.5), size = 10);  # 标签
gridExtra包
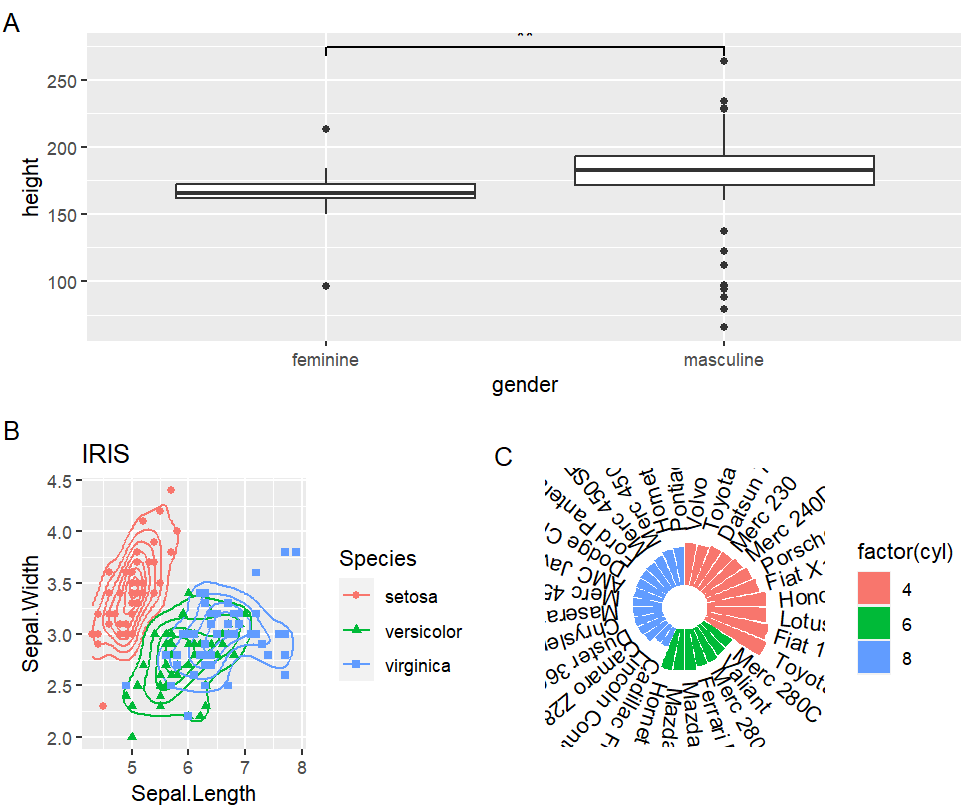
用gridExtra::grid.arrange函数将p1、p2和p4按下面的方式组合在一起
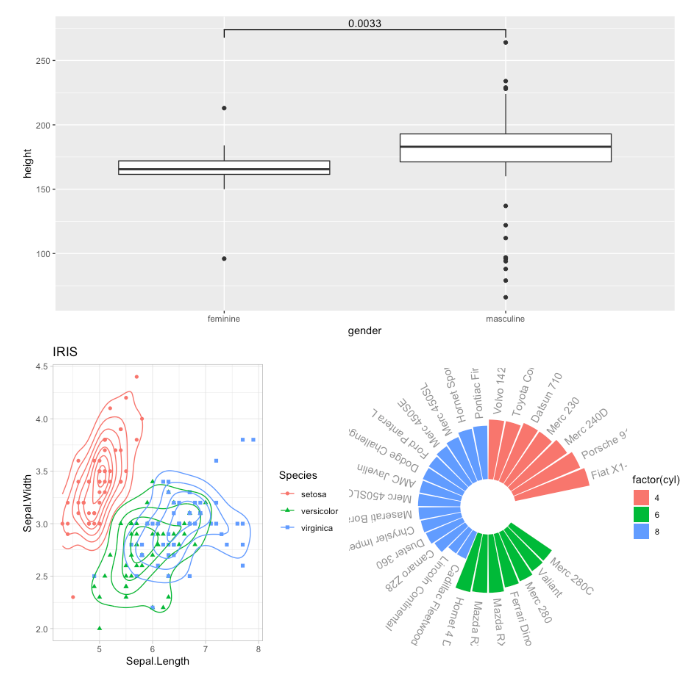
要求为子图加上ABC标签
可以看到分为两列,第一行为第一张图,第二行是剩下的两张图。构建的画图矩阵应为:
     [,1] [,2]
[1,]    1    1
[2,]    2    3
library(gridExtra)
grid.arrange(
  p1+labs(tag = "A"),
  p2+labs(tag = "B"),
  p4+labs(tag = "C"),  # 先为每个图添标签,再组合在一起
  nrow = 2,
  layout_matrix = rbind(c(1,1),c(2,3))  # 画图矩阵
);
拓展:patchwork包
用patchwork包中的相关函数将p1、p2、p3和p4 按下面的方式组合在一起
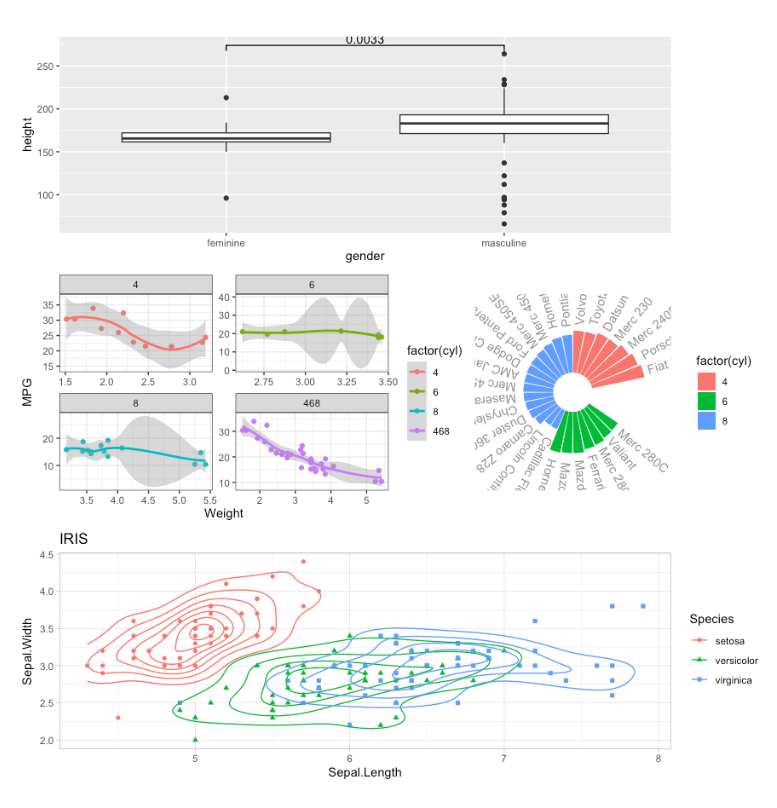
要求为子图加上ABCD标签
对于此题重要使用两个操作符:
-
p1 / p2:将p1和p2竖直堆叠 p1 | p2:将p1和p2并列放置- 可以使用小括号来区分组合优先级
if (!require("patchwork")){
  install.packages("patchwork");
  library("patchwork");
}
p1 <- p1+labs(tag = "A");
p3 <- p3+labs(tag = "B");
p4 <- p4+labs(tag = "C");
p2 <- p2+labs(tag = "D");  # 先为每个图添标签,再组合在一起
p1 / (p3 | p4) / p2;
拓展:lattice包
lattice包内置于R,无需额外安装
它主要提供了绘制网格图形的方法。网格图形能够展示变量的分布或变量之间的关系,每幅图代表一个或多个变量的各个水平
以散点图矩阵(Scatter Plot Matrix)为例:
library(lattice);
lattice::splom( mtcars[c(1,3,4,5,6)] );
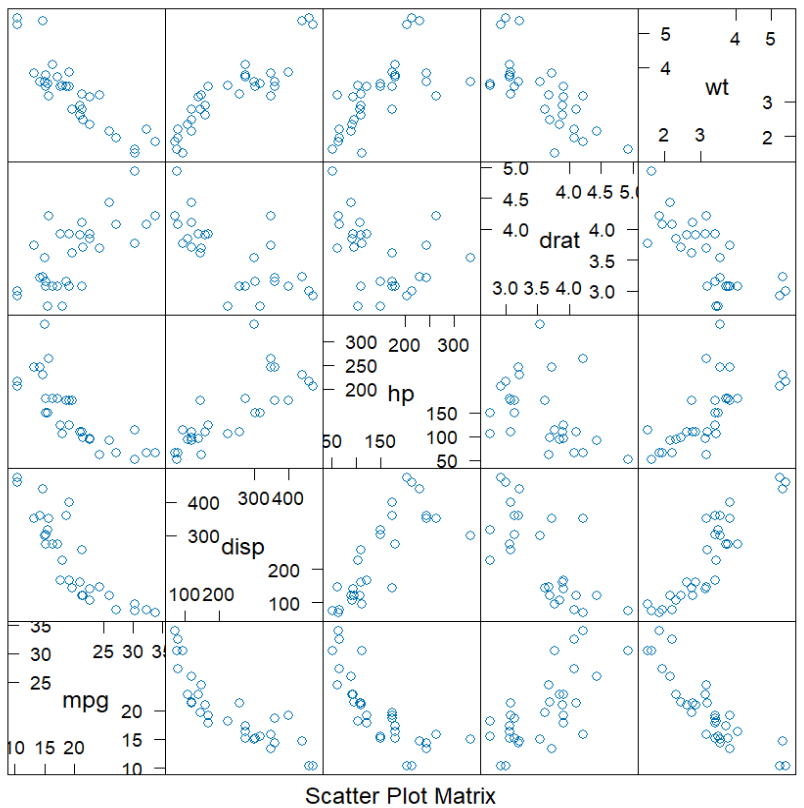
它可以在一张图中展示所有列间的关系。例如左上角第一个格子,它的纵坐标对应着wt,横坐标对应着mpg
与factor配合使用
任务:
-
使用
readr包中的函数读取mouse_genes_biomart_sep2018.txt -
选取常染色体(1~19)和性染色体(X、Y)的基因
-
画各染色体上基因长度中值的箱型图,分别按
-
染色体序号排列(1, 2, 3,…, X, Y)
-
基因长度的中值排列(从短到长)
-
要求:
-
调整y轴范围,让每个箱子都完整显示
-
调整y轴范围时,不能使用
ylim(),因为该函数会去除超出范围的值,使中值计算有偏差
解决方法:使用coord_cartesian(ylim = c(min, max))放大指定区域,这种方法只影响图形展示,不影响内部数据的值,而ylim函数会移除不在指定范围内的数据
画图思路:使用geom_boxplot函数,x轴为染色体名称(先排序),y轴为基因长度。在上一篇笔记中说过,只要将x轴数据设为factor形式,画箱型图函数便会自动将数据分组统计
读取数据:
mouse.genes <- read.delim(
  file = "data\\mouse_genes_biomart_sep2018.txt",
  sep = "\t", header = T, stringsAsFactors = T
);
mouse.genes %>% sample_n(5);

其中Transcript.length..including.UTRs.and.CDS.列是基因长度,Chromosome.scaffold.name是基因位置(在哪条染色体上)
数据初处理:筛选出在指定染色体的基因
chromosome <- c(as.character(1:19), "X", "Y");  # 需要哪些染色体的基因
mouse.chr <- mouse.genes %>%
  filter(Chromosome.scaffold.name %in% chromosome);  # 筛选行
head(mouse.chr);

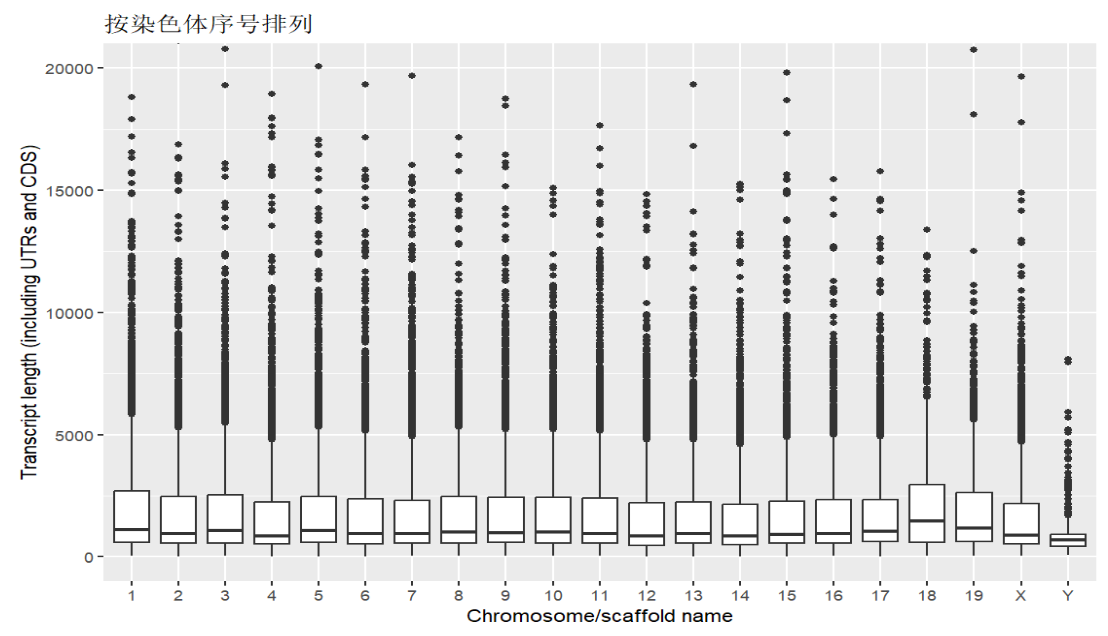
第一个图:按染色体序号排列
方法:将Chromosome.scaffold.name列转为factor,levels为染色体序号顺序
# 转为factor
x1 <- factor(mouse.chr$Chromosome.scaffold.name, levels = chromosome);
# 画图
ggplot(
  mouse.chr,  # 设定画图所用的数据集
  aes(  # 设定x,y轴对应的数据
    x = x1,
    y = Transcript.length..including.UTRs.and.CDS.
  )
) +
  geom_boxplot() +  # 画箱型图
  coord_cartesian(ylim = c(0,20000)) +  # 缩放y轴
  labs(  # 设置xy轴名称和标题
    y = "Transcript length (including UTRs and CDS)",
    x = "Chromosome/scaffold name",
    title = "按染色体序号排列"
  );
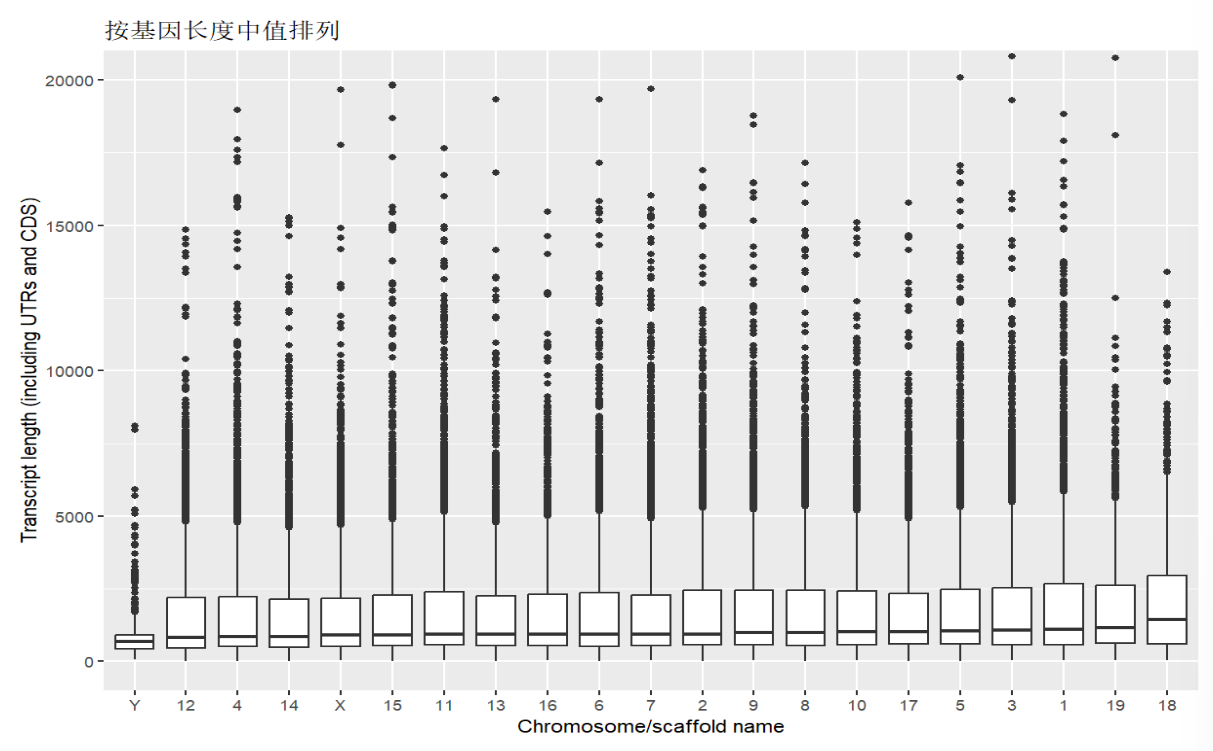
第二个图:按基因长度中值排序
方法:使用reorder(返回结果列, 顺序决定列, 排序方法)函数指定factor顺序,该函数在堆叠柱状图(stacked bars)中说过,这里不再说明
# 转为factor
x2 <- reorder(
  mouse.chr$Chromosome.scaffold.name,  # 返回结果列
  mouse.chr$Transcript.length..including.UTRs.and.CDS.,  # 顺序决定列
  median  # 排序方法
);
# 画图
ggplot(
  mouse.chr,
  aes(
    x = x2,
    y = Transcript.length..including.UTRs.and.CDS.
  )
) +
  geom_boxplot() +
  coord_cartesian(ylim = c(0,20000)) +
  labs(
    y = "Transcript length (including UTRs and CDS)",
    x = "Chromosome/scaffold name",
    title = "按基因长度中值排列"
  );
代码汇总:
mouse.genes <- read.delim(
  file = "..\\data\\mouse_genes_biomart_sep2018.txt",
  sep = "\t", header = T, stringsAsFactors = T );
chromosome <- c(as.character(1:19), "X", "Y");
mouse.chr <- mouse.genes %>%
  filter(Chromosome.scaffold.name %in% chromosome);
# 按染色体序号排列↓
x1 <- factor(mouse.chr$Chromosome.scaffold.name, levels = chromosome);
ggplot(mouse.chr,
       aes(x = x1,
           y = Transcript.length..including.UTRs.and.CDS.)) +
  labs(y = "Transcript length (including UTRs and CDS)",
       x = "Chromosome/scaffold name",
       title = "按染色体序号排列") +
  geom_boxplot() +
  coord_cartesian(ylim = c(0,20000));
# 按中值排列↓
x2 <- reorder(mouse.chr$Chromosome.scaffold.name, mouse.chr$Transcript.length..including.UTRs.and.CDS., median);
ggplot(mouse.chr,
       aes(x = x2,
           y = Transcript.length..including.UTRs.and.CDS.)) +
  labs(y = "Transcript length (including UTRs and CDS)",
       x = "Chromosome/scaffold name",
       title = "按基因长度中值排列") +
  geom_boxplot() +
  coord_cartesian(ylim = c(0,20000));