b站生信课程02-8
r-bioinfolessonb站生信课程TCGA及GEO数据挖掘入门必看P63-P69笔记——相关性分析、批次矫正前后PCA图、更多火山图、IOBR包、免疫检查点基因差异分析
写在前面:本篇教程来自b站课程TCGA及GEO数据挖掘入门必看 P63-P69 相关资料下载
相关性分析
棒棒糖图和散点图
需要数据:tpm表达矩阵、cibersort免疫细胞浸润分析得到的CIBERSORT-Results.txt
if(!require("ggExtra", quietly = T))
{
  install.packages("ggExtra");
}
library(limma);
library(reshape2);
library(ggpubr);
library(ggExtra);
读取数据,合并:
# 表达矩阵
data <- read.table("save_data\\TCGA_LUSC_TPM.txt", check.names = F, row.names = 1, sep = '\t', header = T);
# 仅保留肿瘤样本
group <- sapply(strsplit(colnames(data), "\\-"), "[", 4);
group <- sapply(strsplit(group,""), "[", 1);
data <- data[, group == 0];
# 对A1BG基因进行分析,可以换成其它基因
gene <- "A1BG";
data <- t(data[gene, , drop=F]);
data <- as.data.frame(data);
# 免疫细胞浸润分析数据
immune <- read.table("save_data\\CIBERSORT-Results.txt", header = T, sep = '\t', check.names = F, row.names = 1);
# 仅保留肿瘤样本
group <- sapply(strsplit(rownames(immune), "\\-"), "[", 4);
group <- sapply(strsplit(group,""), "[", 1);
immune <- immune[group == 0, ];
# 合并
sameSample <- intersect(row.names(immune), row.names(data));
rt <- cbind(immune[sameSample, , drop=F], data[sameSample, , drop=F]);
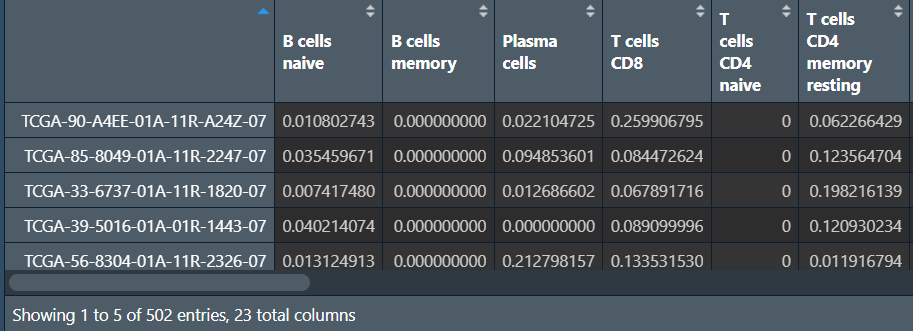
行名是样本名,列是免疫细胞种类和A1BG基因表达量
相关性散点图:每个免疫细胞都和A1BG表达量进行分析,将符合阈值的画图
outTab <- data.frame();
for(i in colnames(rt)[1:(ncol(rt)-1)]){
  x <- as.numeric(rt[, gene]);  # x轴是表达量
  y <- as.numeric(rt[, i]);  # y轴是免疫分析得分
  if(sd(y)==0)  y[1] <- 0.00001;
  # spearman非线性相关\pearson线性相关,哪个结果更符合预期就用哪个
  cor <- cor.test(x, y, method = "spearman");
  outVector <- cbind(Gene = gene, Cell = i, cor = cor$estimate, pvalue = cor$p.value);
  outTab <- rbind(outTab, outVector);
  # 阈值设置为0.05
  if(cor$p.value<0.05){
    outFile <- paste0("save_data\\cor.result\\cor.", i, ".pdf");
    df1 <- as.data.frame(cbind(x, y));
    p1 <- ggplot(df1, aes(x, y)) +
      xlab(paste0(gene, " expression")) +
      ylab(i) +
      geom_point() +
      geom_smooth(method = "lm",formula = y ~ x) +
      theme_bw() +
      stat_cor(method = 'spearman', aes(x = x, y = y));
    p2 <- ggMarginal(
      p1,
      type = "density",
      xparams = list(fill = "orange"),
      yparams = list(fill = "blue")
    );
    #相关性图形
    pdf(file = outFile, width = 5.2, height = 5);
    print(p2);
    dev.off();
  }
}
# 保存
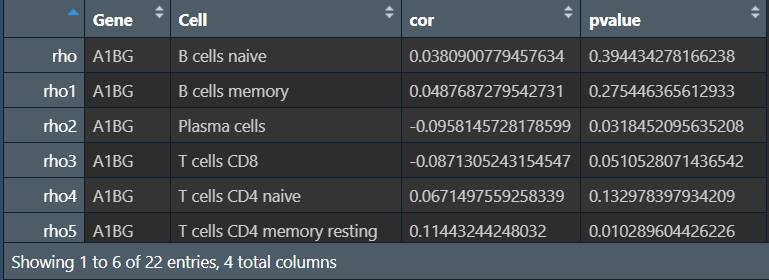
write.table(outTab, file = "save_data\\cor.result\\cor.result.txt", sep = "\t", row.names = F, quote = F);
其中一张图:
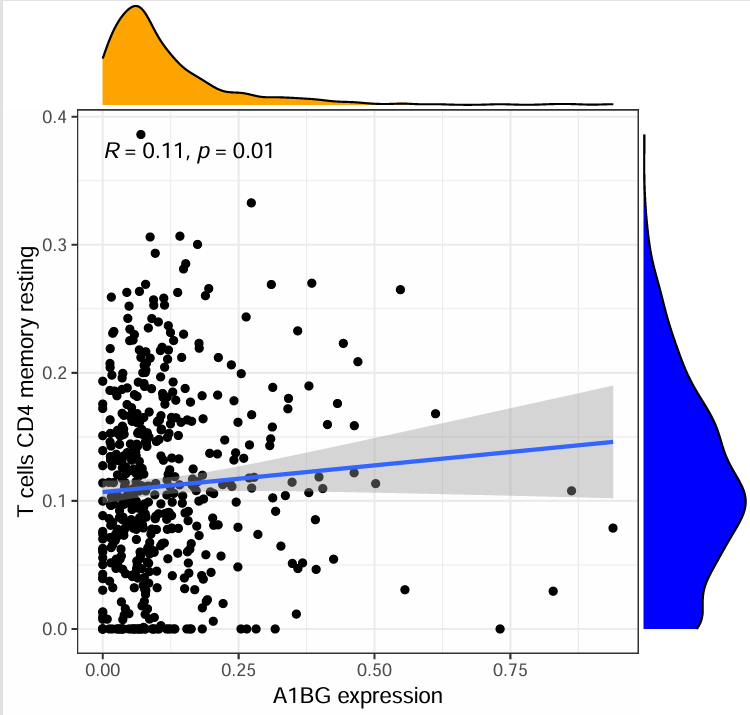
横坐标是指定基因表达量,纵坐标是某个免疫细胞浸润水平,每个点都是一个样本
棒棒糖图:
outTab$cor <- as.numeric(outTab$cor);
outTab$pvalue <- as.numeric(outTab$pvalue);
# 圆圈颜色
p.col <- c('gold', 'pink', 'orange', 'LimeGreen', 'darkgreen');
fcolor <- function(x, p.col){
  color <- ifelse(
    x>0.8, p.col[1],
    ifelse(
      x>0.6, p.col[2],
      ifelse(
        x>0.4, p.col[3],
        ifelse(
          x>0.2, p.col[4], p.col[5]
        )
      )
    )
  );
  return(color);
}
points.color <- fcolor(x = outTab$pvalue, p.col = p.col);
outTab$points.color <- points.color;
# 圆圈大小
p.cex <- seq(2.5, 5.5, length = 5);
fcex <- function(x){
  x <- abs(x);
  cex <- ifelse(
    x<0.1, p.cex[1],
    ifelse(
      x<0.2, p.cex[2],
      ifelse(
        x<0.3, p.cex[3],
        ifelse(
          x<0.4, p.cex[4], p.cex[5]
        )
      )
    )
  );
  return(cex);
}
points.cex <- fcex(x = outTab$cor);
outTab$points.cex <- points.cex;
# 按相关性从高到低排序
outTab <- outTab[order(outTab$cor), ];
# x轴范围
xlim <- ceiling(max(abs(outTab$cor))*10)/10;
# 画图
pdf(file = "save_data\\Lollipop.pdf", width = 9, height = 7);
layout(
  mat = matrix(c(1,1,1,1,1,0,2,0,3,0), nc = 2),
  width = c(8,2.2),
  heights = c(1,2,1,2,1)
);
par(bg = "white", las = 1, mar = c(5,18,2,4), cex.axis = 1.5, cex.lab = 2);
plot(
  1,
  type = "n",
  xlim = c(-xlim,xlim),ylim = c(0.5,nrow(outTab)+0.5),
  xlab = "Correlation Coefficient",ylab = "",
  yaxt = "n",yaxs = "i",axes = F
);
rect(
  par('usr')[1], par('usr')[3], par('usr')[2], par('usr')[4],
  col = "#F5F5F5", border = "#F5F5F5"
);
grid(ny = nrow(outTab), col = "white", lty = 1, lwd = 2);
segments(
  x0 = outTab$cor, y0 = 1:nrow(outTab),
  x1 = 0, y1 = 1:nrow(outTab),
  lwd = 4
);
points(
  x = outTab$cor,
  y = 1:nrow(outTab),
  col = outTab$points.color,
  pch = 16,
  cex = outTab$points.cex
);
text(
  par('usr')[1],
  1:nrow(outTab), outTab$Cell,
  adj = 1, xpd = T, cex = 1.5
);
pvalue.text <- ifelse(
  outTab$pvalue<0.001,
  '<0.001',
  sprintf("%.03f", outTab$pvalue)
);
redcutoff_cor <- 0;
redcutoff_pvalue <- 0.05;
text(
  par('usr')[2],
  1:nrow(outTab), pvalue.text,
  adj = 0, xpd = T, cex = 1.5,
  col = ifelse(
    abs(outTab$cor)>redcutoff_cor & outTab$pvalue<redcutoff_pvalue,
    "red","black"
  )
);
axis(1, tick = F);
par(mar = c(0,4,3,4));
plot(
  1,
  type = "n", axes = F,
  xlab = "",ylab = ""
);
legend(
  "left",
  legend = c(0.1,0.2,0.3,0.4,0.5),
  col = "black", bty = "n", pch = 16,
  pt.cex = p.cex, cex = 2,
  title = "abs(cor)"
);
par(mar = c(0,6,4,6), cex.axis = 1.5, cex.main = 2);
barplot(
  rep(1, 5),
  horiz = T,
  space = 0,
  border = NA,
  col = p.col,
  xaxt = "n", yaxt = "n",
  xlab = "", ylab = "", main = "pvalue"
);
axis(4, at = 0:5, c(1,0.8,0.6,0.4,0.2,0), tick = F);
dev.off();
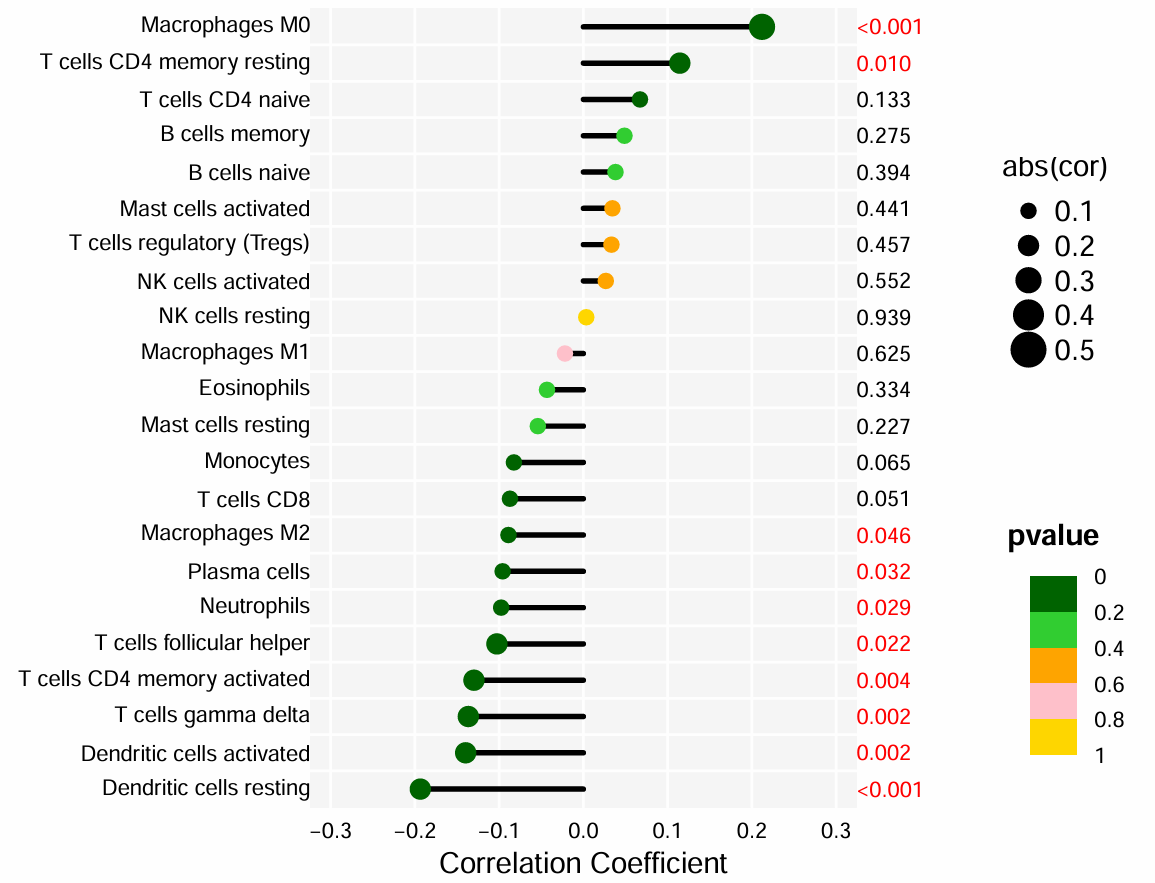
横坐标是相关性系数cor,纵坐标是不同的免疫细胞,点的大小是相关性系数cor,颜色是p值
因为是随便选的基因,所以相关性都不高
mRNA-lncRNA共表达分析
将第一节中数据预处理-TCGA数据-表达数据中new_matrix <- subset(x = new_matrix, gene_type=="protein_coding")根据protein_coding筛选改成根据lncRNA筛选,得到TCGA_LUSC_lncRNA.txt
还需要tpm表达矩阵(mRNA表达数据)
if(!require("ggalluvial", quietly = T))
{
  install.packages("ggalluvial");
}
library(limma);
library(dplyr);
library(ggalluvial);
library(ggplot2);
library(igraph);
读取数据:
# mRNA表达矩阵
mRNA <- read.table("save_data\\TCGA_LUSC_TPM.txt", check.names = F, row.names = 1, sep = '\t', header = T);
# 仅保留肿瘤样本
group <- sapply(strsplit(colnames(mRNA), "\\-"), "[", 4);
group <- sapply(strsplit(group,""), "[", 1);
mRNA <- mRNA[, group == 0];
# 去除低质量mRNA
mRNA <- mRNA[rowMeans(mRNA)>0.5, ];
# 提取自己感兴趣的mRNA
mRNA <- mRNA[1:10, ];
# lncRNA表达矩阵
lncRNA <- read.table("save_data\\TCGA_LUSC_lncRNA.txt", check.names = F, row.names = 1, sep = '\t', header = T);
# 仅保留肿瘤样本
group <- sapply(strsplit(colnames(lncRNA), "\\-"), "[", 4);
group <- sapply(strsplit(group,""), "[", 1);
lncRNA <- lncRNA[, group == 0];
# 去除低质量lncRNA
lncRNA <- lncRNA[rowMeans(lncRNA)>0.5, ];
lncRNA <- lncRNA[apply(lncRNA, 1, sd)>0.5, ];
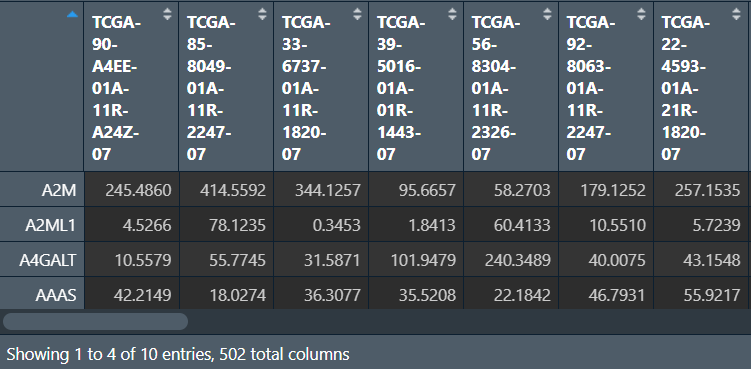
mRNA:
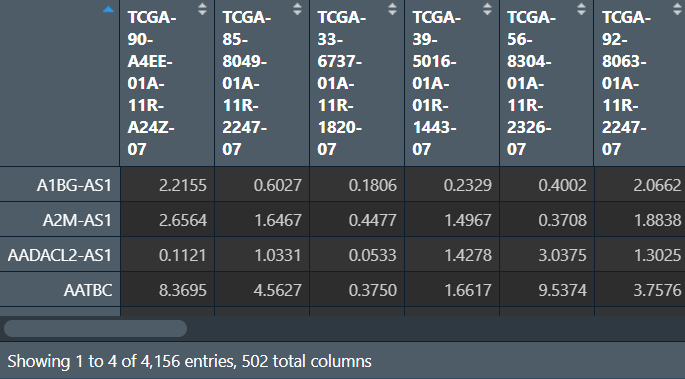
lncRNA:
进行分析:
# 筛选阈值
corFilter <- 0.3;
pvalueFilter <- 0.001;
# 相关性检验
outTab <- data.frame();
for(i in row.names(lncRNA)){
  for(j in row.names(mRNA)){
    x <- as.numeric(mRNA[j, ]);
    y <- as.numeric(lncRNA[i, ]);
    # spearman非线性相关\pearson线性相关,哪个结果更符合预期就用哪个
    corT <- cor.test(x, y, method = "pearson");
    cor <- corT$estimate;
    pvalue <- corT$p.value;
    regulation <- ifelse(
      cor>corFilter, "postive",
      ifelse(
        cor<(-corFilter), "negative", "none"
      )
    );
    if(regulation!="none" & (pvalue<pvalueFilter)){
      outTab <- rbind(
        outTab,
        cbind(
          mRNA = j,
          lncRNA = i,
          cor,
          pvalue,
          Regulation = regulation
        )
      );
    }
  }
}
# 保存结果
write.table(outTab, file = "save_data\\lncRes.txt", sep = "\t", quote = F, row.names = F);
# 保存筛选出的lncRNA的表达矩阵
LncRNA2 <- unique(as.vector(outTab[, "lncRNA"]));
LncRNAexp <- lncRNA[LncRNA2, ];
write.table(
  rbind(ID = colnames(LncRNAexp), LncRNAexp),
  file = "save_data\\LncExp.txt",
  sep = "\t", quote = F, col.names = F
);
outTab:

cor和pvalue是mRNA和lncRNA的相关性系数和p值,regulation是它们的相互作用关系(相关性系数>0为”postive”,反之为”negative”)
LncRNAexp:
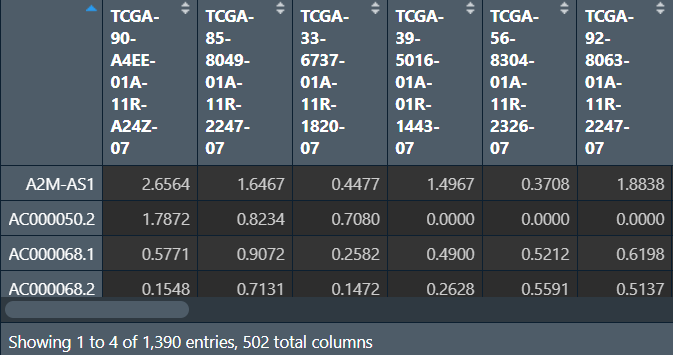
画图:mRNA与lncRNA的对应关系连线
rt <- outTab;
# 第一张图
# 颜色
mycol <- rep(c('#AB3282', '#53A85F', '#F1BB72', '#F3B1A0', '#D6E7A3', '#57C3F3', '#476D87', '#E95C59', '#E59CC4','#E5D2DD' , '#23452F', '#BD956A', '#8C549C', '#585658', '#9FA3A8', '#E0D4CA', '#5F3D69', '#C5DEBA', '#58A4C3', '#E4C755', '#F7F398', '#AA9A59', '#E63863', '#E39A35', '#C1E6F3', '#6778AE', '#91D0BE', '#B53E2B', '#712820', '#DCC1DD', '#CCE0F5',  '#CCC9E6', '#625D9E', '#68A180', '#3A6963', '#968175'), 10);
# 画图
p1 <- ggplot(
  data = rt,
  aes(axis1 = lncRNA, axis2 = mRNA, y = 1)
) +
  geom_alluvium(
    aes(fill = mRNA),
    width = 0.1,
    knot.pos = 0.1,
    reverse = F
  ) +
  geom_stratum(
    fill = NA, color = NA,
    alpha = 0.5,
    width = 0.1
  ) +
  geom_text(
    stat = 'stratum',
    size =1.5,
    color='black',
    label.strata = T
  ) +
  scale_fill_manual(values = mycol) +
  scale_x_discrete(
    limits = c('lncRNA','mRNA'),
    expand = c(0, 0)
  ) +
  xlab("") +
  ylab("") +
  theme_bw() +
  theme(
    axis.line = element_blank(),
    axis.ticks = element_blank(),
    axis.text.x = element_blank(),
    panel.grid = element_blank(),
    panel.border = element_blank()
  ) +
  coord_flip() +
  ggtitle("");
pdf(file = "save_data\\Lnccor1.pdf", width = 9, height = 5);
print(p1);
dev.off();

# 第二张图
# 准备
lncNode <- data.frame(
  Node = unique(as.vector(rt[, "lncRNA"])),
  Type = "lncRNA"
);
mrnaNode <- data.frame(
  Node = unique(as.vector(rt[,"mRNA"])),
  Type = "mRNA"
);
nodeOut <- rbind(lncNode, mrnaNode);
color <- ifelse(nodeOut$Type=="lncRNA", '#58A4C3', '#9FA3A8');
value <- ifelse(nodeOut$Type=="lncRNA", 2, 5);
fontSize <- ifelse(nodeOut$Type=="lncRNA", 0.01, 0.65);
node <- data.frame(
  id = nodeOut$Node,
  label = nodeOut$Node,
  color = color,
  shape = "dot",
  value = value,
  fontSize = fontSize
);
edge <- data.frame(
  from = rt$lncRNA,
  to = rt$mRNA,
  length = 100,
  arrows = "middle",
  smooth = TRUE,
  shadow = FALSE,
  weight = as.numeric(rt$cor)
);
d <- data.frame(
  p1 = edge$from,
  p2 = edge$to,
  weight = abs(edge$weight)
);
g <- graph.data.frame(d, directed = FALSE);
E(g)$color <- "grey";
V(g)$size <- node$value[match(
  names(components(g)$membership),
  node$label
)];
V(g)$shape <- "sphere";
V(g)$lable.cex <- node$fontSize[match(
  names(components(g)$membership),
  node$label
)];
V(g)$color <- node$color[match(
  names(components(g)$membership),
  node$label
)];
# 画图
pdf("save_data\\Lnccor2.pdf", width = 9, height = 8);
layout(mat = matrix(c(1,2,1,2), nc = 2), height = c(1,11));
par(mar = c(0,0,0,0));
plot(
  1,
  type = "n",
  axes = F,
  xlab = "",ylab = ""
);
legend(
  'center',
  legend = c('lncRNA','mRNA'),
  col = c('#58A4C3', '#9FA3A8'),
  pch = 16,
  bty = "n",
  ncol = 2,
  cex = 2
);
vertex.frame.color <- node$color;
edge_col <- E(g)$color;
plot(
  g,
  layout = layout_on_sphere,
  vertex.size = V(g)$size,
  vertex.label = node$label,
  vertex.label.cex = V(g)$lable.cex,
  edge.width = 0.05,
  edge.arrow.size = 0,
  vertex.label.color = NULL,
  vertex.frame.color = NA,
  edge.color = edge_col,
  vertex.label.font = 2
);
dev.off();
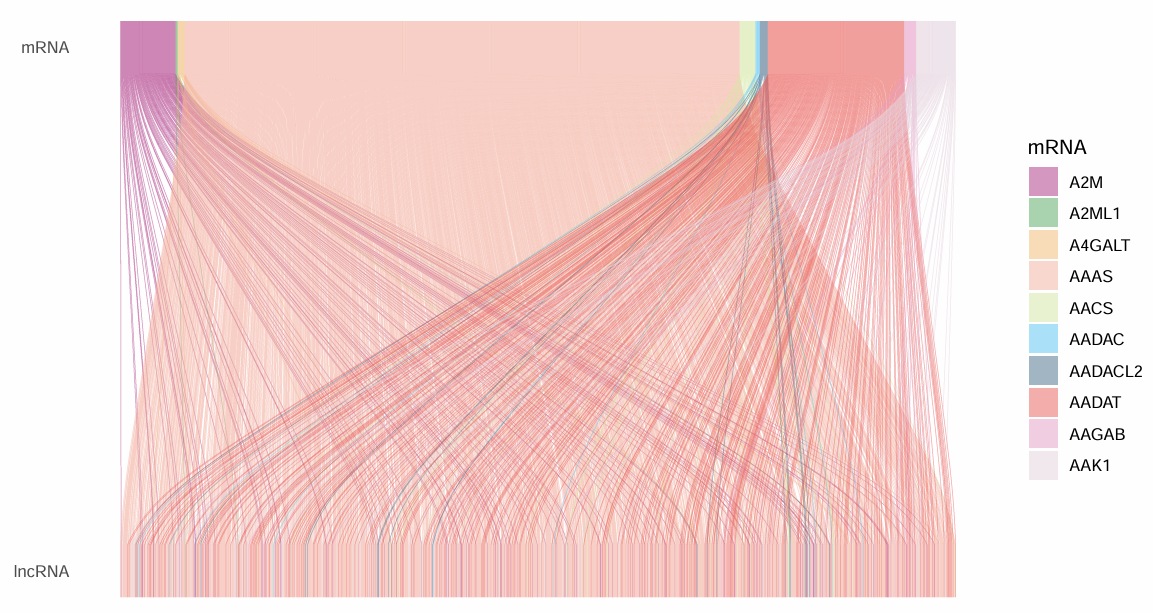
上面是mRNA,下面是lncRNA,右边图例是mRNA的,因为lncRNA数量太多,没有显示它们的名称
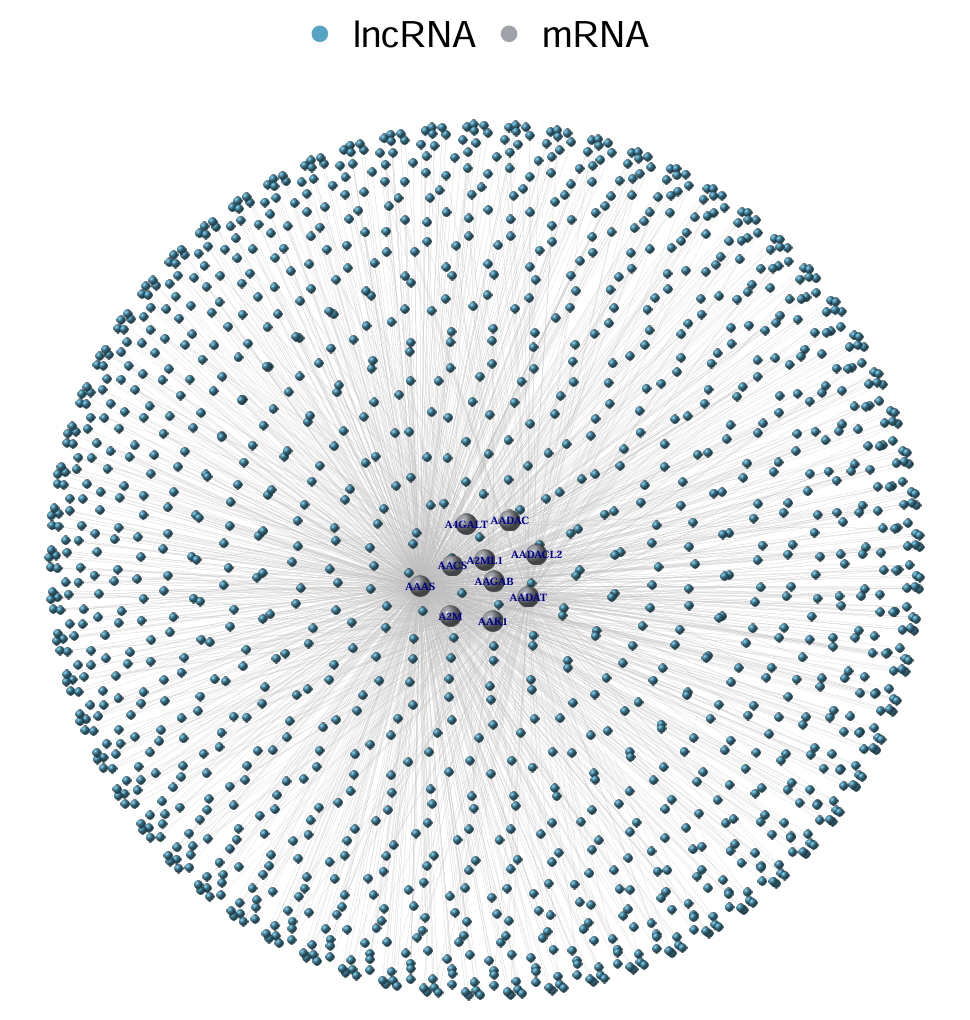
中间的大球是mRNA,周围的小球是lncRNA
注:还可以画热图(参照之前cibersort的热图)
批次矫正前后PCA图
使用数据:GSE30219、GSE74777、tpm表达矩阵
具体方法与第一篇中去批次效应相同,这里只是多画了PCA图
library(limma);
library(sva);
library(ggplot2);
读取三个表达矩阵,去批次效应:(同之前的方法)
# 文件路径
files <- c("save_data\\TCGA_LUSC_TPM.txt", "data\\GSE30219\\GSE30219.txt","data\\GSE74777\\GSE74777.txt");
gene_list <- list();
# 读取数据并初步处理
for (i in 1:length(files)) {
  rt <- read.table(files[i], header = T, sep = '\t', check.names = F, row.names = 1);
  dimnames <- list(rownames(rt), colnames(rt));
  rt <- matrix(as.numeric(as.matrix(rt)), nrow = nrow(rt),  dimnames = dimnames);
  if(substr(colnames(rt)[1], 1, 3)=='TCG'){
    rt <- log2(rt+1);
  }
  if(substr(colnames(rt)[1], 1, 3)=='GSM'){
    rt <- normalizeBetweenArrays(rt);
  }
  gene_list[[i]] <- rt;
  if(i==1){
    gene <- rownames(gene_list[[1]]);
  }
  else{
    gene <- intersect(gene, rownames(gene_list[[i]]));
  }
}
# 合并并创建分组信息
for (i in 1:length(files)) {
  if(i==1){
    merge_data <- gene_list[[1]][gene, ];
    batch_type <- c(rep(1, ncol(gene_list[[1]])));
  }
  else{
    merge_data <- cbind(merge_data, gene_list[[i]][gene, ]);
    batch_type <- c(batch_type, rep(i, ncol(gene_list[[i]])));
  }
}
# 去除批次效应
outTab <- ComBat(merge_data, batch_type, par.prior = T);
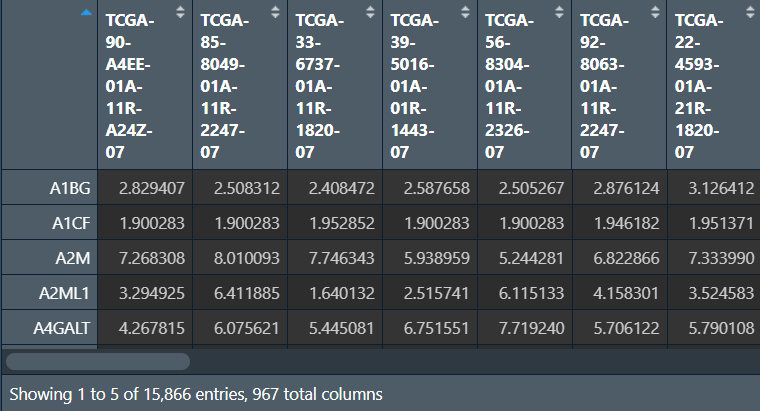
画图:
# 画图函数
draw_PCA <- function(data, res_path){  # 行名是样本名,列名是基因名
  # 标签
  Project <- c(
    rep("TCGA", table(batch_type==1)[2]),
    rep("GSE30219", table(batch_type==2)[2]),
    rep("GSE74777", table(batch_type==3)[2])
  );
  # PCA分析
  data.pca <- prcomp(data);
  pcaPredict <- predict(data.pca);
  PCA <- data.frame(PC1 = pcaPredict[, 1], PC2 = pcaPredict[, 2], Type = Project);
  # 颜色
  bioCol <- c("#FF0000", "#0066FF", "#FF9900", "#6E568C", "#7CC767", "#223D6C", "#D20A13", "#FFD121");
  bioCol <- bioCol[1:length(levels(factor(Project)))];
  # 画图
  p <- ggplot(data = PCA, aes(PC1, PC2)) +
    geom_point(aes(color = Type)) +
    scale_colour_manual(name = "",  values = bioCol) +
    theme_bw() +
    theme(
      plot.margin = unit(rep(1.5, 4), 'lines'),
      panel.grid.major = element_blank(),
      panel.grid.minor = element_blank()
    );
  pdf(file = res_path, height = 5, width = 6);
  print(p);
  dev.off();
  return(PCA);
}
# 画图,分别是去批次前后的表达矩阵
PCA_res1 <- draw_PCA(t(merge_data), "save_data\\PCA1.pdf");
PCA_res2 <- draw_PCA(t(outTab), "save_data\\PCA2.pdf");
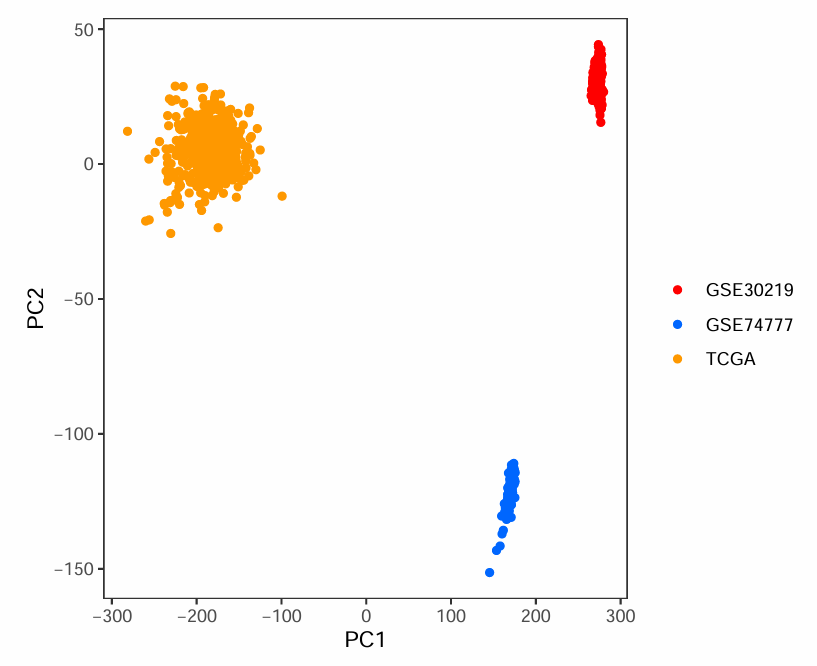
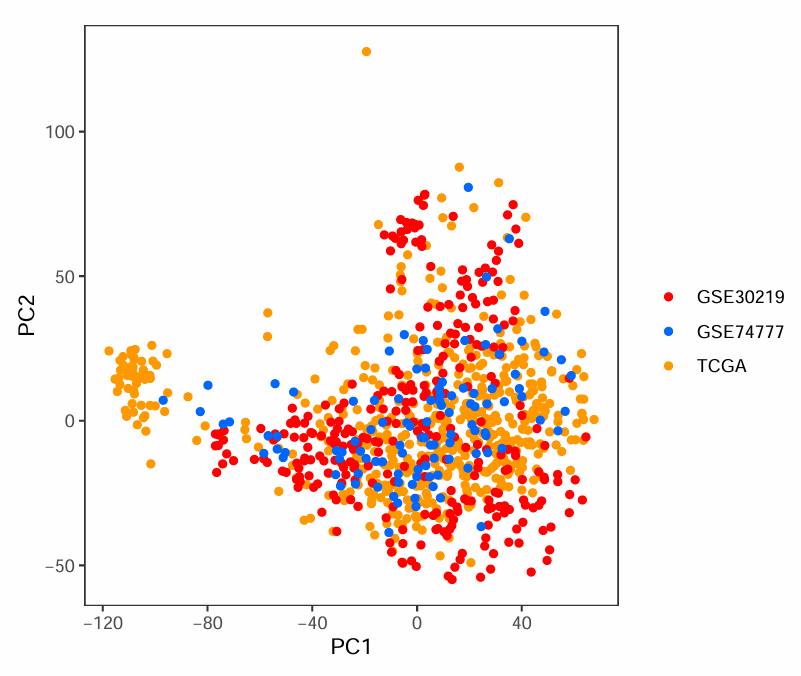
可以看到第一张图中同种颜色的点都集中在一起,不同颜色点离得很远,说明批次效应较强。通常希望像第二张图一样,不同颜色的点(不同数据集的样本)都混在一起
更多种类火山图
使用数据:上一篇笔记中GEO的Bayes差异表达分析结果Bayes.all.gene.txt
library(ggVolcano);
读取数据、标注差异基因:
# 读取数据
data1 <- read.table("save_data\\Bayes.all.gene.txt", header=T, sep="\t", check.names=F)
# 标注差异基因
data2 <- add_regulate(
  data1,
  log2FC_name = "logFC", log2FC = 1,  # logFC筛选
  fdr_name = "adj.P.Val", fdr = 0.05  # fdr(p值)筛选
);

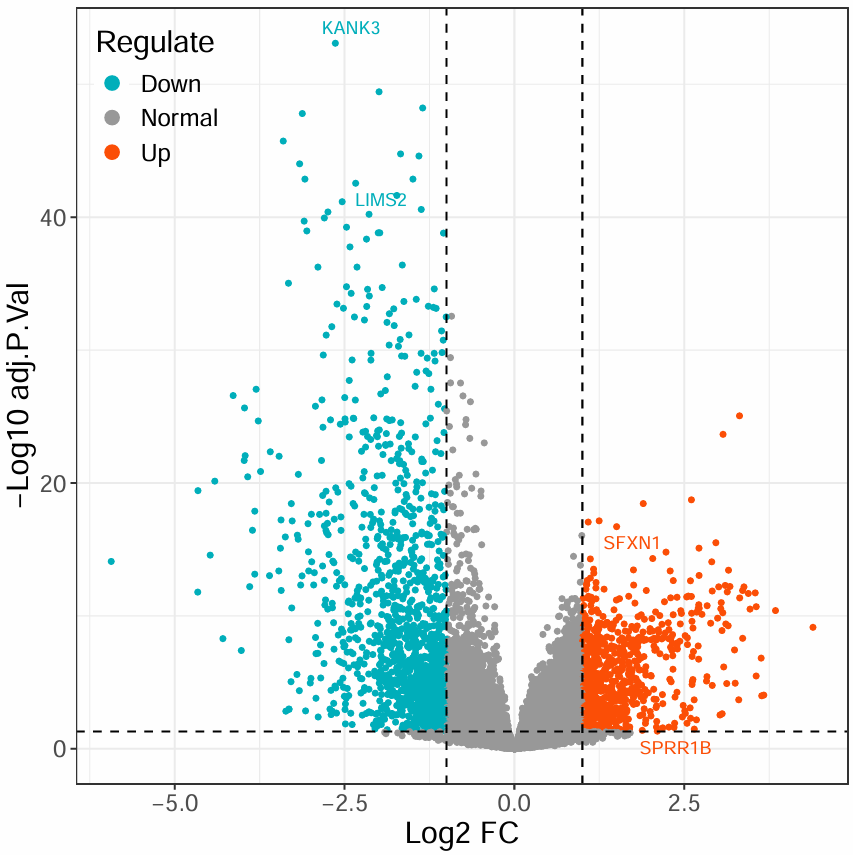
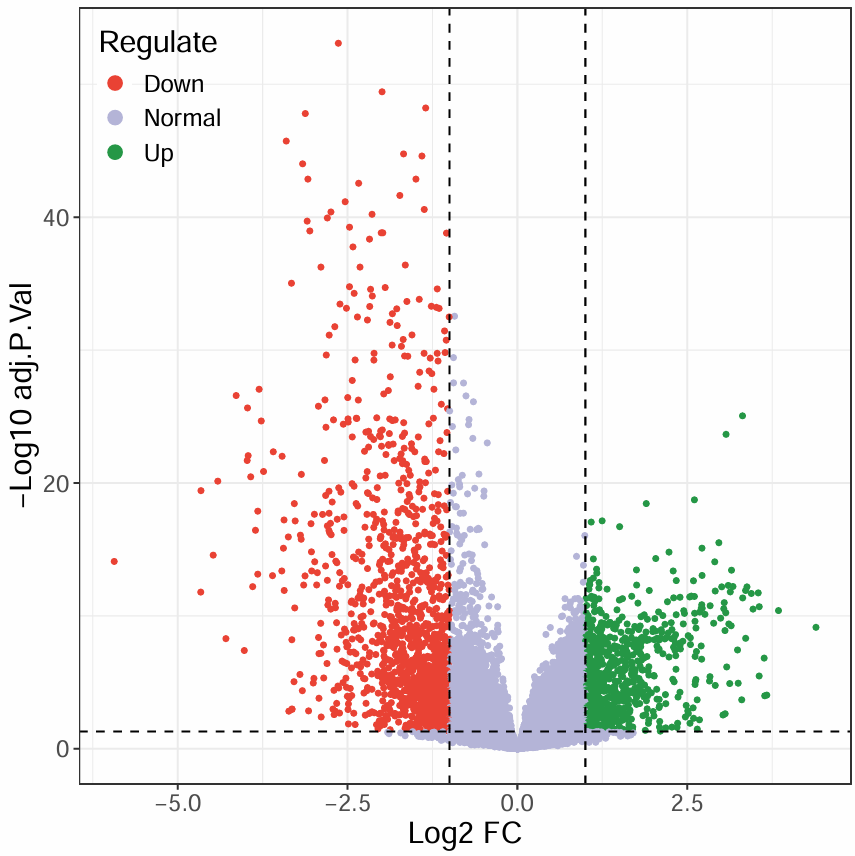
主要多了regulate列,标记表达量偏高(logFC>1)/偏低(logFC<-1)/差异小(-1<logFC<1);同时列名也发生了改变
画图:
# 坐标轴名称
ID <- "id";  # 基因名称
Xname <- "Log2 FC";  # logFC
Yname <- "-Log10 adj.P.Val";  # p值
# 标记感兴趣的基因(这里是随便选的4个)
genes <- c("KANK3","LIMS2","SPRR1B","SFXN1");
# 第一种火山图
pdf(file = "save_data\\vol1.pdf", width = 6, height = 6);
ggvolcano(
  data2,
  x = "log2FoldChange", y = "padj",
  x_lab = Xname, y_lab = Yname,
  label = ID, custom_label = genes,
  output = FALSE
);
dev.off();
# 第二种火山图(更换颜色)
colors <- c("#e94234", "#b4b4d8", "#269846")
pdf(file = "save_data\\vol2.pdf", width = 6, height = 6);
ggvolcano(
  data2,
  fills = colors, colors = colors,
  x = "log2FoldChange", y = "padj",
  x_lab = Xname, y_lab = Yname,
  label = ID, custom_label = F,  # 没有感兴趣的基因就是F
  output = FALSE
);
dev.off();
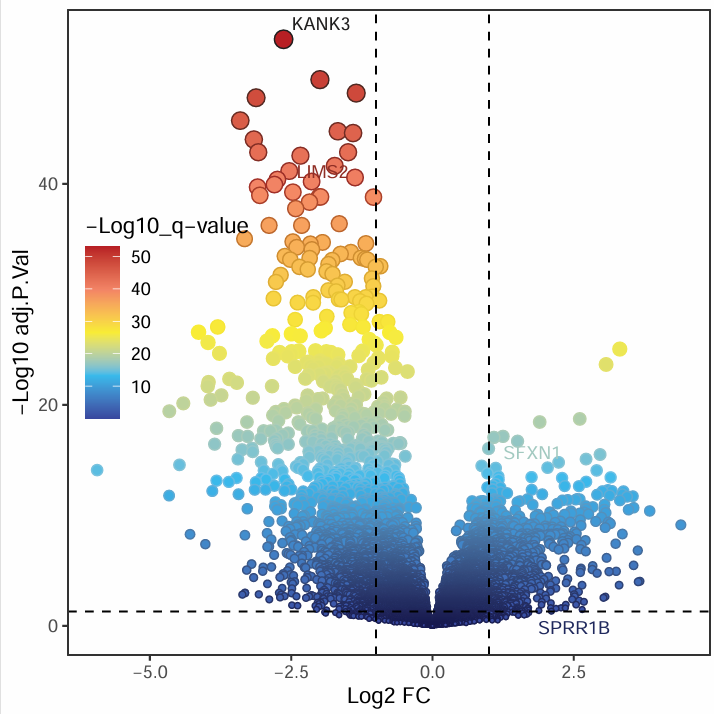
# 第三种火山图(渐变色)
pdf(file = "save_data\\vol3.pdf", width = 5, height = 5);
gradual_volcano(
  data2,
  x = "log2FoldChange", y = "padj",
  x_lab = Xname, y_lab = Yname,
  label = ID, custom_label = genes,
  output = FALSE
);
dev.off();
第一种火山图:
第二种火山图(更换颜色):
第三种火山图(渐变色):
IOBR包的其它分析方法
肿瘤微环境、免疫肿瘤学特征等等
注:过程中若出现Calling gsva(expr=., gset.idx.list=., method=., ...) is defunct报错,就安装1.48版本的GSVA包:找到GSVA的安装文件(R安装目录中的library文件夹内),删除名为GSVA的文件夹,将GSVA.1.48.zip中的GSVA文件夹解压到library文件夹下(替换原来的GSVA)
使用数据:tpm表达矩阵
if(!require("GSVA", quietly = T))
{
  library("BiocManager");
  BiocManager::install("GSVA");
}
library(IOBR);
读取数据:
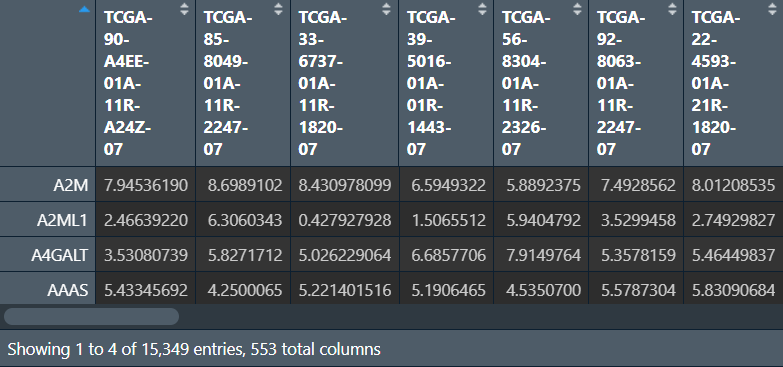
data <- read.table("save_data\\TCGA_LUSC_TPM.txt", check.names = F, row.names = 1, sep = '\t', header = T);
data <- log2(data+1);  # 取log2,也可以不取,看哪个结果符合预期
data <- data[rowMeans(data)>0.5, ];  # 去除低表达的基因
肿瘤微环境分析:
共有8种方法:’mcpcounter’、’epic’、’xcell’、’cibersort’、’ips’、’quantiseq’、’estimate’、’timer’
# IOBR包的8种分析
im_mcpcounter <- deconvo_tme(eset = data, method = "mcpcounter");
im_epic <- deconvo_tme(eset = data, method = "epic", arrays = F);
im_xcell <- deconvo_tme(eset = data, method = "xcell", arrays = F);
im_cibersort <- deconvo_tme(eset = data, method = "cibersort", arrays = F, perm = 1000);
im_ips <- deconvo_tme(eset = data, method = "ips", plot = F);
im_quantiseq <- deconvo_tme(eset = data, method = "quantiseq", scale_mrna = T);
im_estimate <- deconvo_tme(eset = data, method = "estimate");
im_timer <- deconvo_tme(eset = data, method = "timer", group_list = rep("coad", dim(data)[2]));
# GSVA免疫基因集分析(ssgsea)
im_genesets <- signature_collection;
im_ssgsea <- calculate_sig_score(eset = data, signature = signature_collection, method = "ssgsea");
# 上述结果合并
tme_combine <- im_mcpcounter %>%
  inner_join(im_epic, by = "ID") %>%
  inner_join(im_xcell, by = "ID") %>%
  inner_join(im_cibersort, by = "ID") %>%
  inner_join(im_ips, by = "ID") %>%
  inner_join(im_quantiseq, by = "ID") %>%
  inner_join(im_estimate, by = "ID") %>%
  inner_join(im_timer, by = "ID") %>%
  inner_join(im_ssgsea, by = "ID");
# 保存
saveRDS(tme_combine, "save_data\\tme_combine.rds");
# 加载
# tme_combine <- readRDS('save_data\\tme_combine.rds');
im_genesets:

第一列name是基因集名字(一级分类),这里都是免疫相关的基因集;value列是其包含的基因(二级分类)
tme_combine:
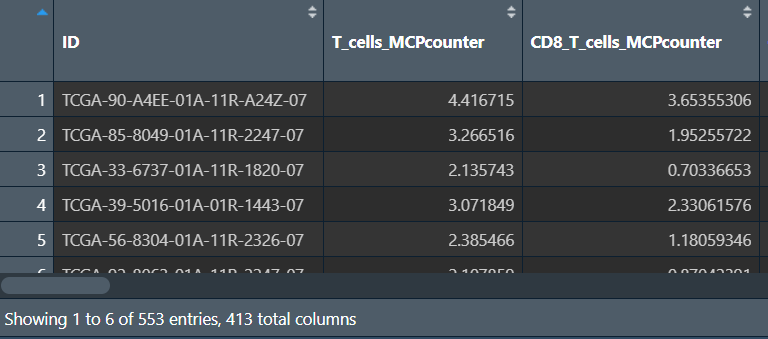
第一列是样本名,后面的是各样本在各种分析中的得分
分组(正常/肿瘤)、画图:
# 分组,第一列是样本名,第二列是属于哪组
group <- sapply(strsplit(colnames(data),"\\-"), "[", 4);
group <- sapply(strsplit(group, ""), "[", 1);
group <- gsub("2", "1", group);
group <- gsub("1", "Normal", group);
group <- gsub("0", "Tumor", group);
Type <- cbind(tme_combine[, 1], group);

# 查看这些基因集属于什么类型,可修改名字
# signature_group <- sig_group;
# names(signature_group)[1];
# names(signature_group)[1] <- "Tumor_Signature";

# 画图
iobr_cor_plot(
  pdata_group = Type,
  id1 = "ID", id2 = "ID",
  feature_data = tme_combine,
  group = "group",
  is_target_continuous = F,
  category = "signature",
  character_limit = 60,
  # signature_group = sig_group[c(1:10)],
  palette_box = "jco",
  ProjectID = "TCGA",
  path = "save_data/iobr_cor_plot/"
);

# 引用
# citation123 <- signature_collection_citation;  # 各基因集都出自哪个文献
# citation("IOBR");  # 在文献中使用IOBR包如何引用
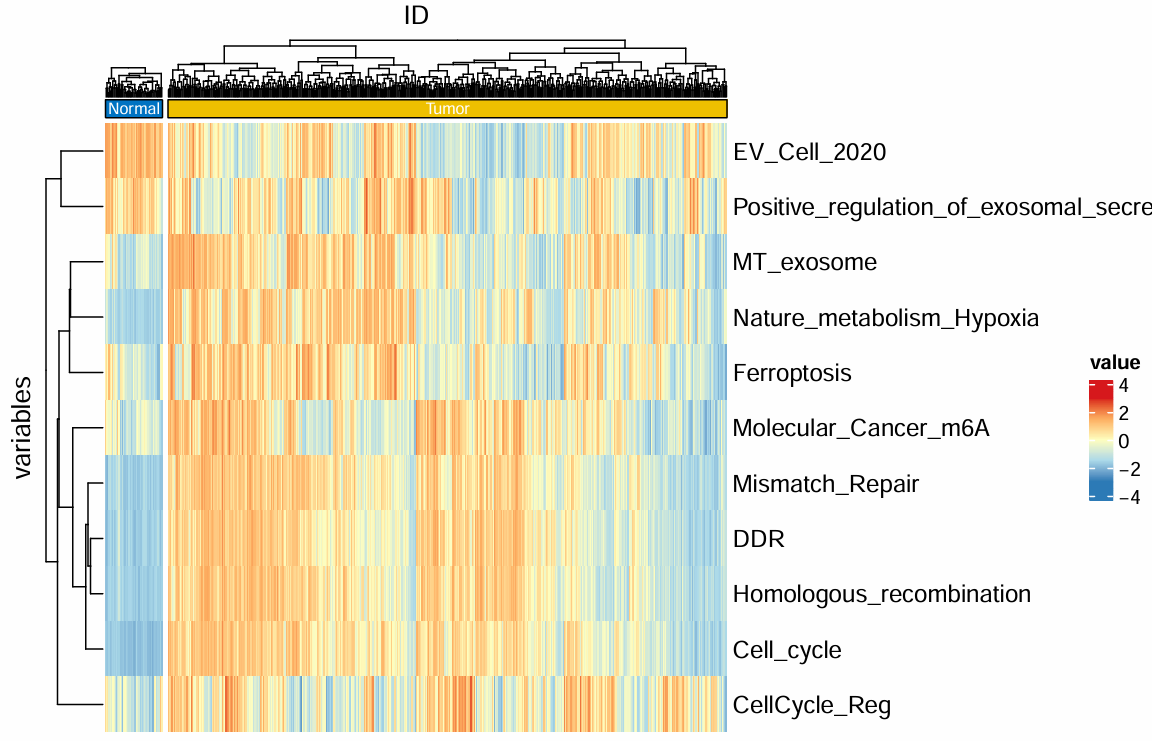
是根据signature_group中的基因集分类进行画图,每一类都画了三种图:
-
箱线图1:
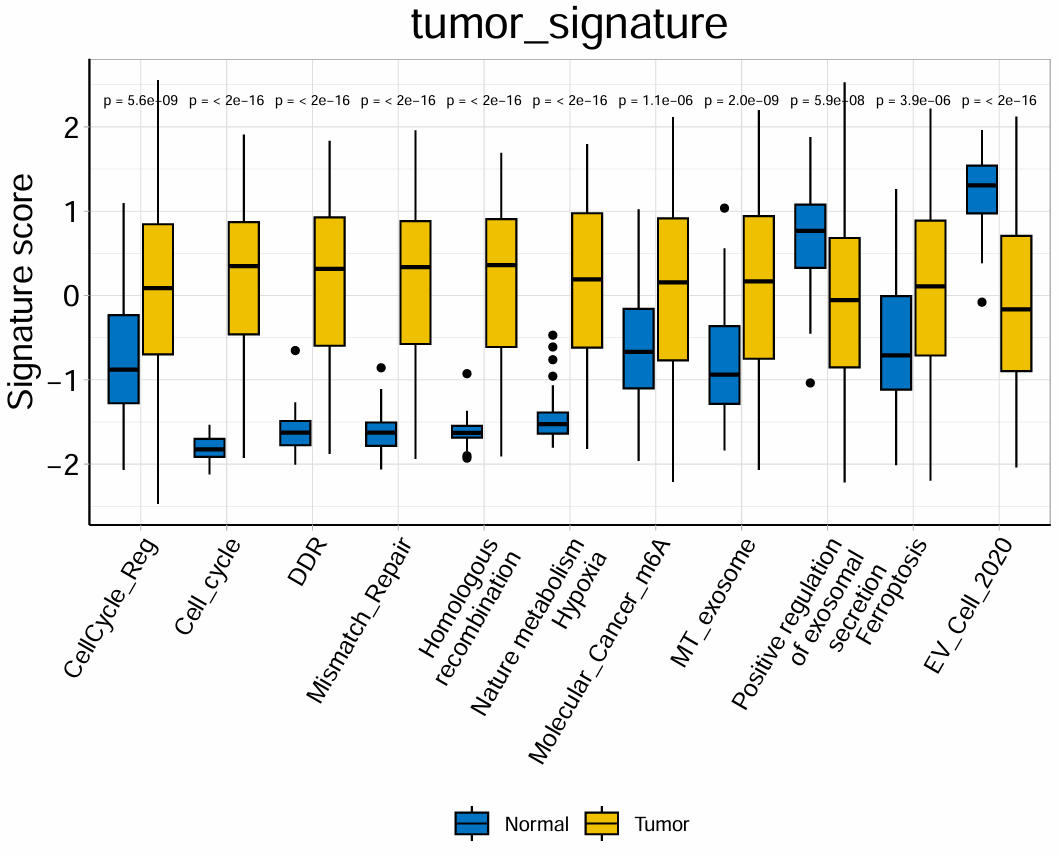
按正常/肿瘤分组,横坐标是不同的免疫细胞,纵坐标是得分,上面标注两组是否有显著差异
-
箱线图2:同第一种,只是p值显示从具体值换成了
*表示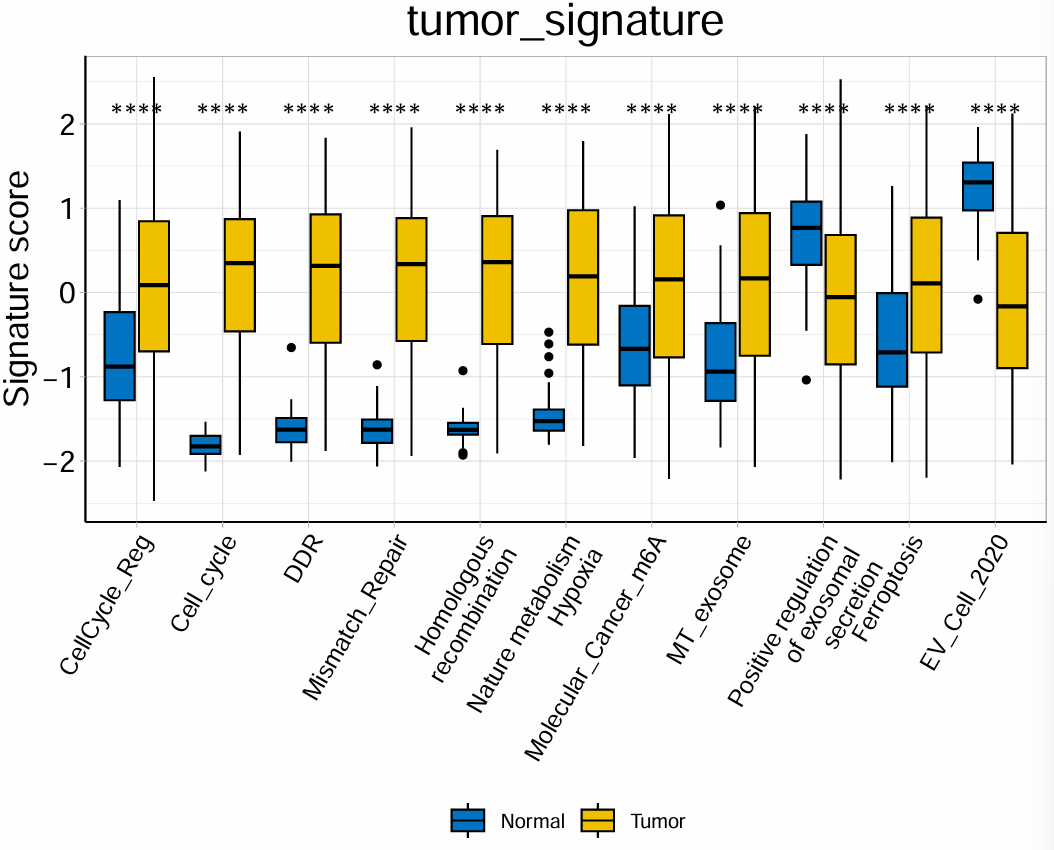
-
热图:
免疫检查点基因的差异分析(ICG)
类似于上一篇中的GEO基因差异分析,只不过把目标基因换成免疫检查点相关基因,并按高/低风险分组
需要数据:风险得分、tpm表达矩阵、免疫检查点基因名称ICGs.txt
library(limma);
library(reshape2);
library(ggplot2);
library(ggpubr);
读取数据并分组:
# 表达矩阵
data <- read.table("save_data\\TCGA_LUSC_TPM.txt", check.names = F, row.names = 1, sep = '\t', header = T);
# 基因列表
gene <- read.table("data\\ICGs.txt", check.names = F, sep = '\t', header = F);
# 取出免疫检查点基因的表达量
sameGene <- intersect(rownames(data), as.vector(gene[, 1]));
data <- t(data[sameGene, ]);
data <- log2(data+1);  # 取log2,让图更好看
# 仅保留肿瘤样本
group <- sapply(strsplit(rownames(data), "\\-"), "[", 4);
group <- sapply(strsplit(group,""), "[", 1);
data <- data[group == 0, ];
rownames(data) <- substr(rownames(data), 1, 12);  # 样本名仅保留前12字符
# 分组信息
risk <- read.table("save_data\\risk.txt", header = T, sep = "\t", check.names = F, row.names = 1);
# 合并
sameSample <- intersect(row.names(data), row.names(risk))
rt1 <- cbind(data[sameSample, ], risk[sameSample, ]);
rt1 <- rt1[, c(sameGene, "risk")];
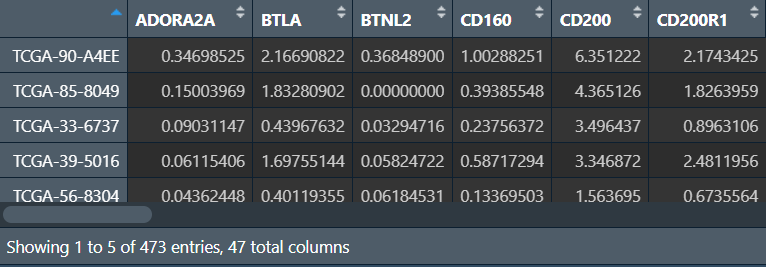
筛选差异基因:
pvalue.sig <- 0.05;  # p值阈值
sigGene <- c();
for(i in colnames(rt1)[1:(ncol(rt1)-1)]){
  if(sd(rt1[, i])<0.001){next}
  wilcoxTest <- wilcox.test(rt1[, i] ~ rt1[, "risk"]);
  pvalue <- wilcoxTest$p.value;
  if(wilcoxTest$p.value < pvalue.sig){
    sigGene <- c(sigGene, i);
  }
}
sigGene <- c(sigGene, "risk");
rt1 <- rt1[, sigGene];
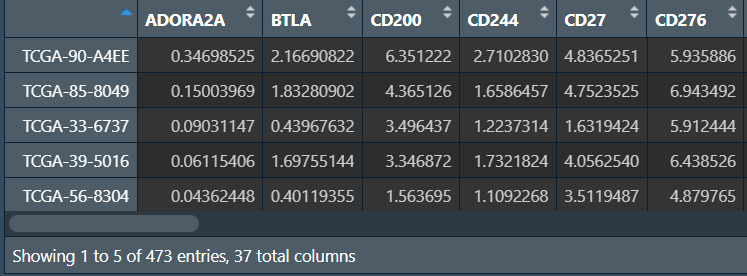
画图:
# 数据宽变长
rt1 <- melt(rt1, id.vars = c("risk"));
colnames(rt1) <- c("risk", "Gene", "Expression");
# 颜色
jco <- c("#0048A1", "#E71D36");
# 画图
boxplot <- ggplot(
  data = rt1,
  aes(x = Gene, y = Expression, fill = risk)
) +
  scale_fill_manual(values = jco[2:1]) +
  geom_violin(
    alpha = 0.4,
    position = position_dodge(width = .75),
    size = 0.8,
    color = "black"  # 边框线颜色
  ) +
  geom_boxplot(
    notch = TRUE,
    outlier.size = -1,
    color = "black",
    lwd = 0.8,
    alpha = 0.7
  ) +
  geom_point(
    shape = 21,
    size = 0.5,
    position = position_jitterdodge(),
    color = "black",
    alpha = 0.05
  ) +
  theme_classic() +
  ylab(expression("Gene expression")) +
  xlab("") +
  rotate_x_text(50) +
  stat_compare_means(
    aes(group = risk),
    method = "wilcox.test",
    symnum.args = list(
      cutpoints = c(0, 0.001, 0.01, 0.05, 1),
      symbols = c("***", "**", "*", "ns")
    ),
    label = "p.signif"
  ) +
  theme(
    axis.ticks = element_line(
      size = 0.2,
      color = "black"
    ),
    axis.ticks.length = unit(0.2, "cm"),
    axis.text = element_text(
      face = "bold.italic",
      colour = "#441718",
      size = 16
    ),
    axis.title = element_text(
      face = "bold.italic",
      colour = "#441718",
      size = 16
    ),
    axis.line = element_blank(),
    plot.title = element_text(
      face = "bold.italic",
      colour = "#441718",
      size = 16
    ),
    panel.border = element_rect(
      fill = NA,
      color = "#35A79D",
      size = 1.5,
      linetype = "solid"
    ),
    panel.background = element_rect(fill = "#F1F6FC"),
    panel.grid.major = element_line(
      color = "#CFD3D6",
      size = .5,
      linetype = "dotdash"
    ),
    legend.text = element_text(face = "bold.italic"),
    legend.title = element_text(
      face = "bold.italic",
      size = 13
    )
  );
pdf(file = "save_data\\IGC.diff.pdf", width = 11, height = 5);
print(boxplot);
dev.off();
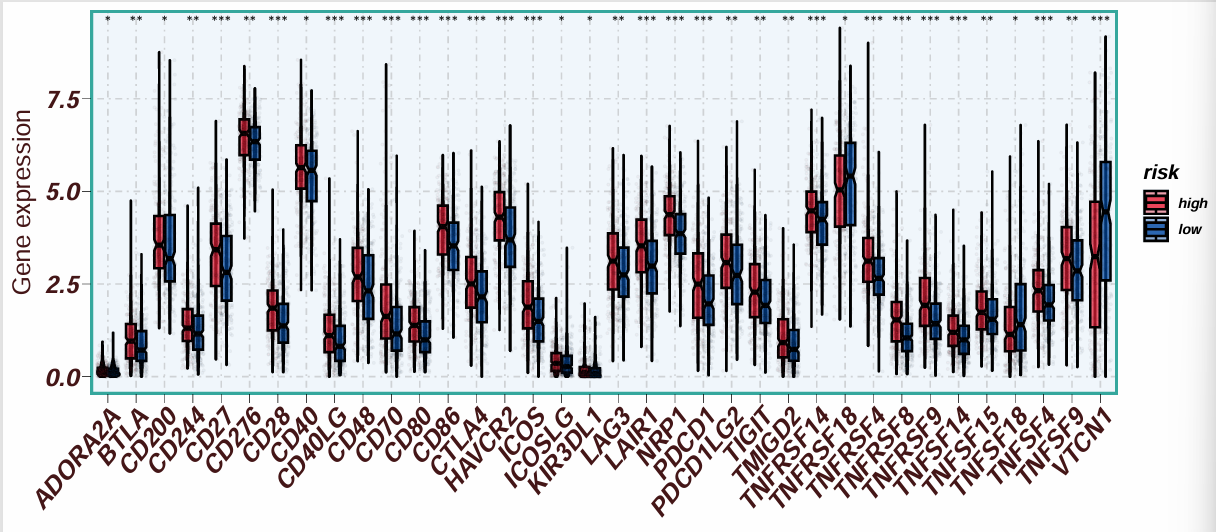
按高/低风险分组,横坐标是基因名,纵坐标是其对应的在两组中的表达量
注:因为这里进行了p值筛选,所以所有基因都有*差异